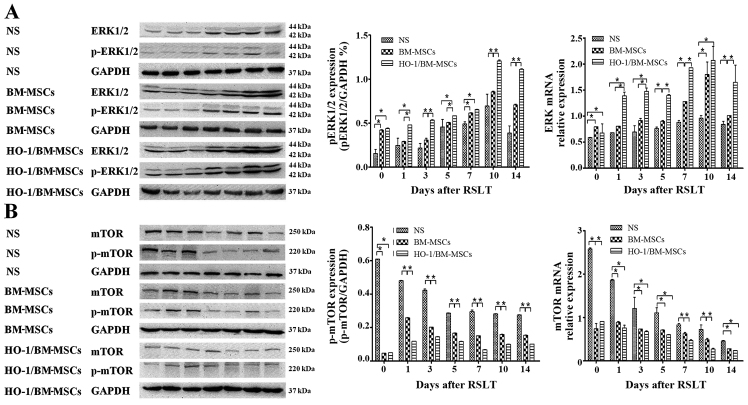
Figure 7.
Expression of ERK1/2, p-ERK1/2, mTOR and p-mTOR after reduced-size liver transplantation. (A) Relative content of ERK1/2 to p-ERK1/2, as measured by RT-qPCR and western blotting. The amount of ERK mRNA in the HO-1/BM-MSCs-treated group was significantly higher than that of the normal saline (NS)-treated group at each time-point, and that in the HO-1/BM-MSCs-treated group was significantly higher than that of the BM MS treated-group except on POD 0 and POD 10. The amount of p-ERK1/2 in the BM-MSCs-treated group was significantly higher than that in the NS-treated group on POD 0, POD 3, POD 7, POD 10 and POD 14. The amount of p-ERK1/2 in the HO-1/BM-MSCs-treated group was significantly higher than that of the BM-MSCs-treated group at each time-point, except on POD 0 and POD 7, and was significantly higher than that in the NS-treated group at each time-point. (B) Relative content of mTOR to p-mTOR, as measured by RT-qPCR and western blotting. The amount of mTOR mRNA in the HO-1/BM-MSCs-treated group was significantly lower than that of the NS-treated group at each time-point, and that in the HO-1/BM-MSCs-treated group was significantly lower than the BM-MSCs-treated group except on POD 7 and POD 10. The amount of p-mTOR in the BM-MSCs-treated group was significantly lower than that in the NS-treated group at each time-point. The level of p-mTOR in the HO-1/BM-MSCs-treated group was significantly lower than that in the BM-MSCs-treated group at each time-point, except on POD 0, and was significantly lower than that in the NS-treated group at each time-point. *P<0.05 as indicated. ERK, extracellular signal-regulated kinase; mTOR, mammalian target of rapamycin; HO-1/BM-MSCs, HO-1 transduced BM-MSCs; POD, post-operative day; RT-qPCR, reverse transcription-quantitative polymerase chain reaction.

