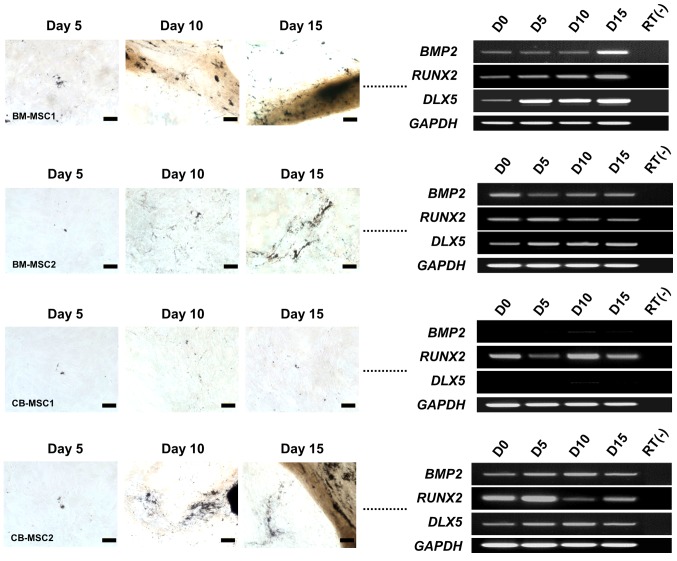
Figure 2.
Time course images of osteogenic differentiation and expression of osteogenesis-related markers. Top panels: images of BM-MSC1 induced by osteogenic medium, and RT-PCR analysis of osteogenesis-associated markers in BM-MSC1. Second row: images of BM-MSC2 differentiated by osteogenic medium, and RT-PCR analysis of osteogenesis-related markers in BM-MSC2. Third row: images of CB-MSC1 induced by osteogenic medium, and RT-PCR analysis of osteogenesis-associated markers in CB-MSC1. Lower panels: images of CB-MSC2 induced by osteogenic medium, and RT-PCR analysis of osteogenesis-related markers in CB-MSC2. Osteogenesis was evaluated by Von Kossa staining (scale bar, 100 µm; magnification, ×200).

