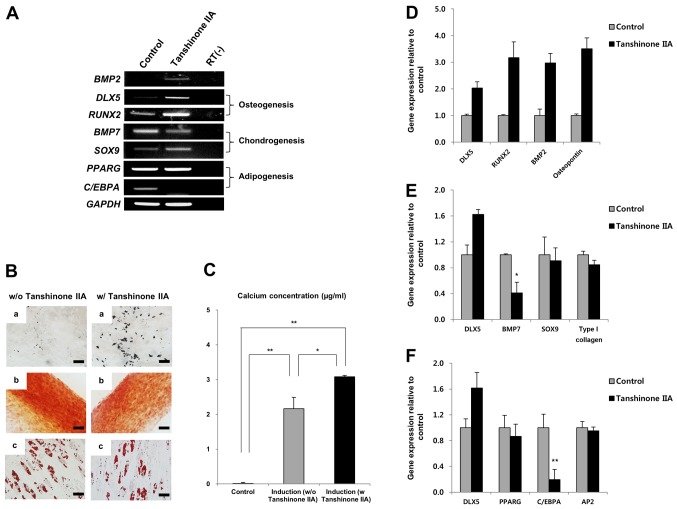
Figure 5.
Changes in mesenchymal stem cells (MSCs) following tanshinone IIA treatment. (A) RT-PCR analysis of osteogenesis-, chondrogenesis- and adipogenesis-associated genes in the control and tanshinone IIA-induced MSCs. Increased osteogenic differentiation of MSCs by tanshinone IIA. (B) Induction of distal-less homeobox 5 (DLX5) expression enhanced osteogenesis of DLX5 not-expressing MSCs. The differentiation capacity of the cells was analyzed after induction. (a) Osteogenesis assessed by Von Kossa staining (scale bar, 50 µm). (b) Chondrogenesis assessed by safranin O staining (scale bar, 100 µm). (c) Adipogenesis assessed by Oil Red O staining (scale bar, 50 µm). (C) Calcium concentrations were measured in triplicate using a Calcium LiquiColor test. Relative mRNA expression levels of differentiation-associated markers in the control and DLX5-induced MSCs after (D) osteogenic induction, (E) chondrogenic induction, and (F) adipogenic induction. *P<0.05 and **P<0.01.

