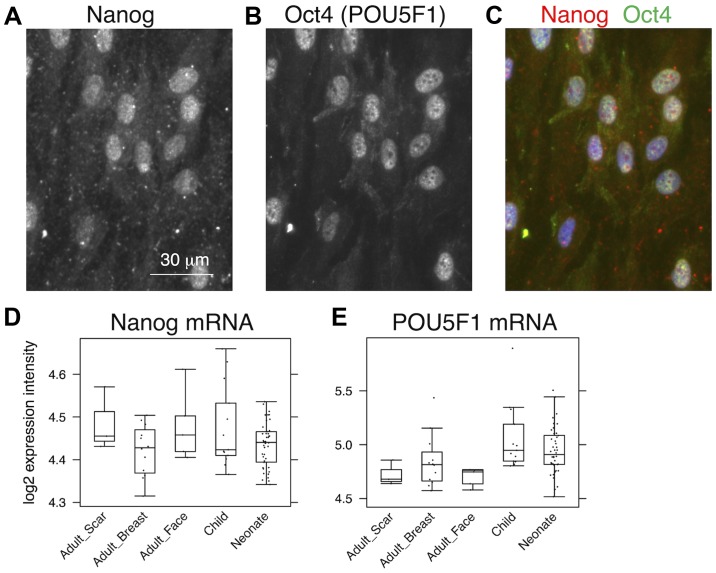
Figure 3.
Detection of Nanog and Oct4 was performed by double staining immunocychemistry at single-cell level in neonatal fibroblasts that were negative for smooth muscle actin. Visualization of Nanog in (A) red tetramethylrhodamine channel, (B) Oct4 in green fluorescein isothiocyanate channel and (C) merged figure. (D and E) Data from expression profiles, where no significant differences were identified. Oct4, octamer-binding transcription factor 4.

