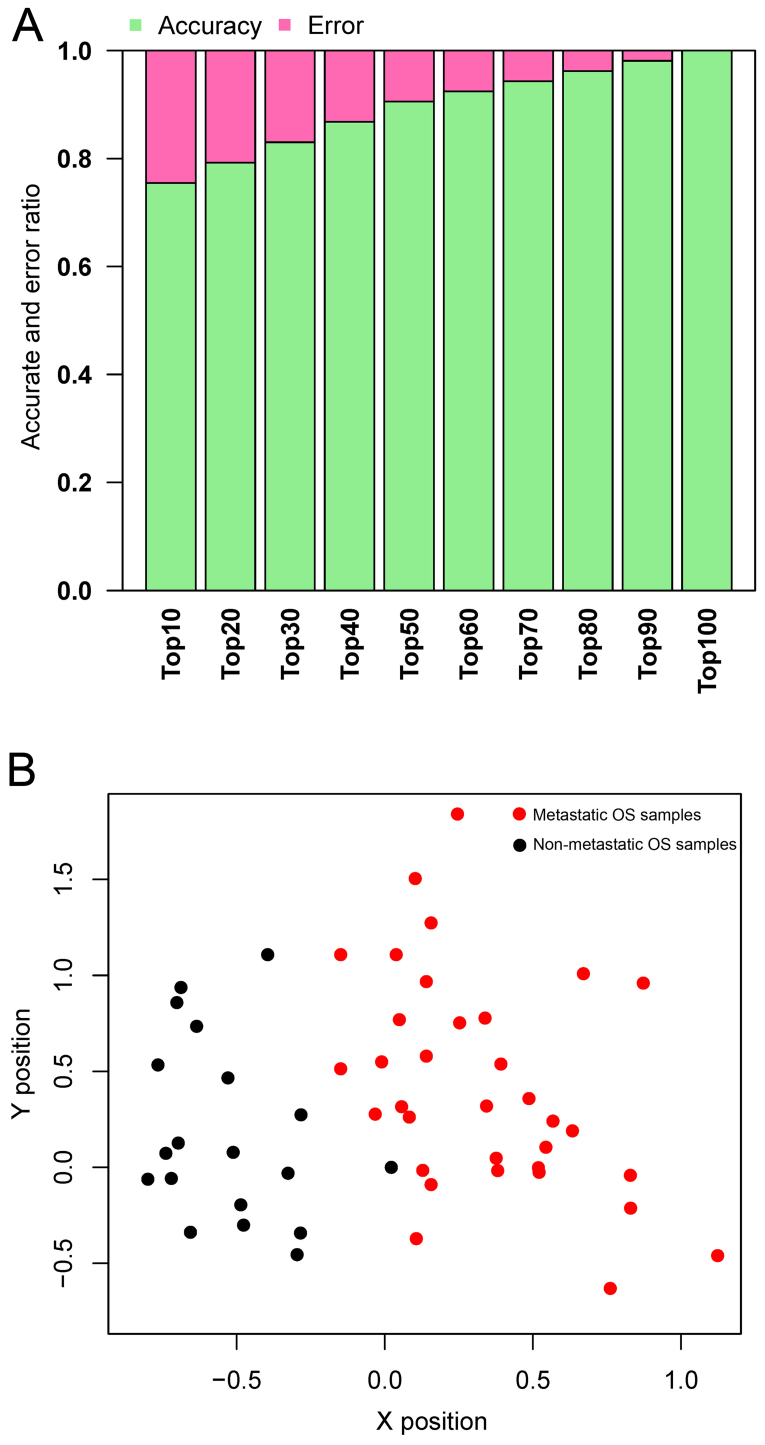
Figure 4.
(A) Predictive accuracy with different numbers of featured genes. Accuracy is indicated in green, while error rate is indicated in red. (B) Scatter plots describing prediction results of dataset GSE21257. Metastatic OS samples are in red while non-metastatic OS samples are in black. OS, osteosarcoma.

