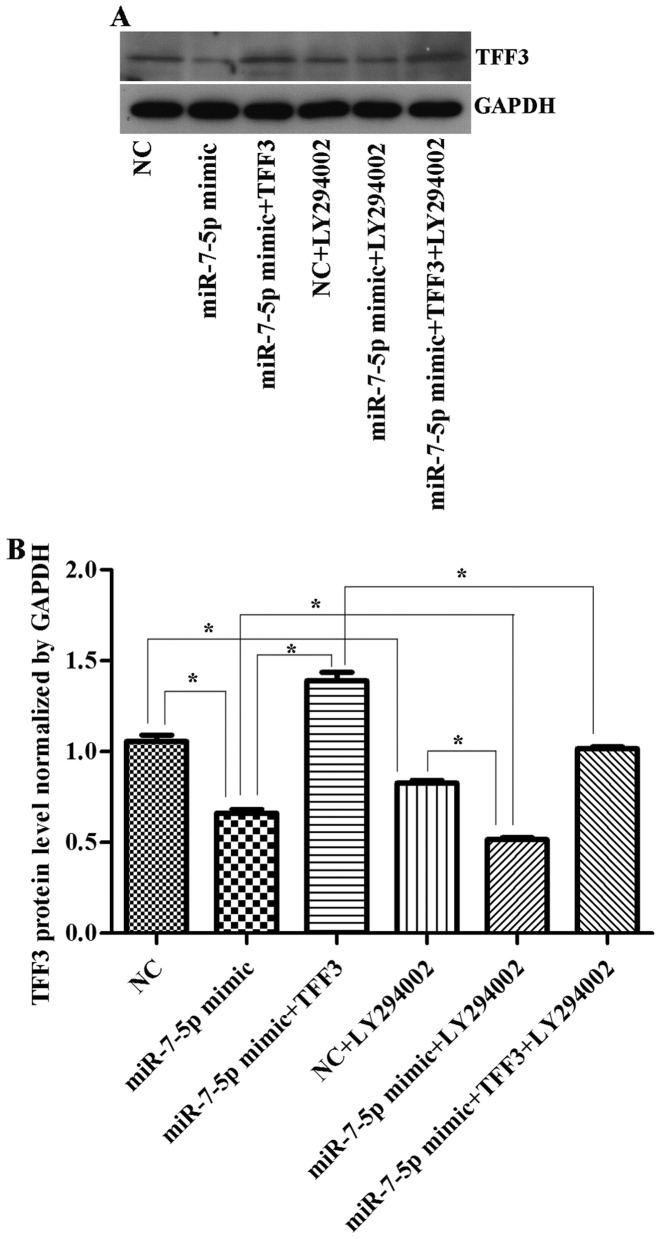
Figure 6.
(A) Western blot detection of TFF3 expression levels in cells following transfection with miR-7-5p mimics, TFF3 plasmid and LY294002. GAPDH served as the loading control. (B) Quantitative analysis of TFF3 protein expression levels normalized to GAPDH levels. The assays were performed in triplicate. All values are presented as the means ± standard deviation of three replicates. *P<0.05. TFF3, trefoil factor 3; miR, microRNA; GAPDH, glyceraldehydes-3-phosphate dehydrogenase; NC, negative control.

