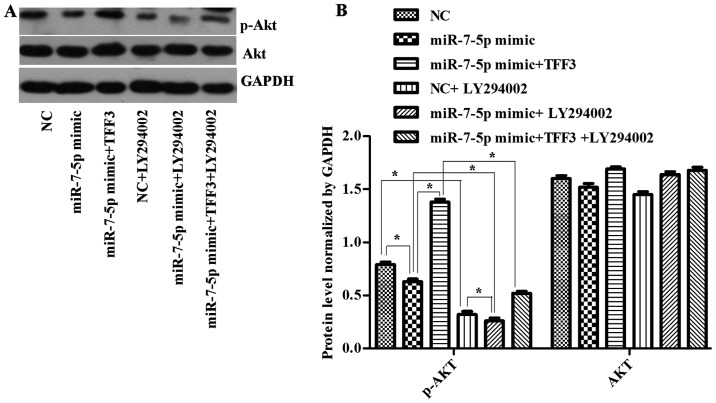
Figure 8.
(A) Western blot detection of Akt and p-Akt levels in cells following transfection with miR-7-5p mimics, TFF3 plasmid and LY294002. GAPDH served as the loading control. (B) Quantitative analysis of Akt and p-Akt protein expression levels normalized to GAPDH levels. The assays were performed in triplicate. All values are presented as the means ± standard deviation of three replicates. *P<0.05. p, phosphorylated; TFF3, trefoil factor 3; miR, microRNA; GAPDH, glyceraldehydes-3-phosphate dehydrogenase; NC, negative control.

