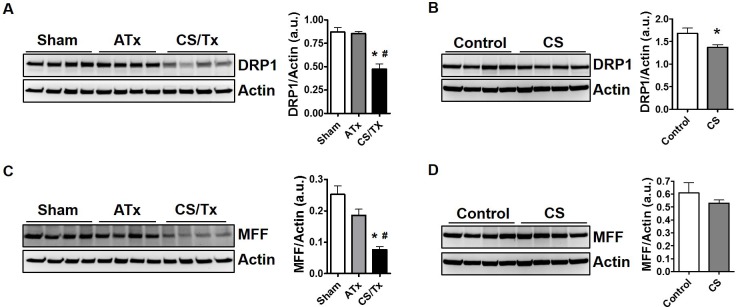
Fig 4. Cold storage alone and cold storage plus transplantation alters mitochondrial fission proteins, but autotransplantation has no effect.
Renal extracts (30 ug) were resolved on SDS-PAGE gels and immunoblotted. Representative DRP1 western blot showing distinct protein bands of DRP1 (~75 kDa) in Sham, ATx, and CS/Tx kidneys (A) as well as control and CS alone kidneys (B). Actin was used as a loading control. Densitometry evaluation of each blot (normalized to actin) is shown on the right panel. Representative MFF western blot showing distinct protein bands of MFF (~38 kDa) in Sham, ATx, and CS/Tx kidneys CS/Tx (C) as well as control and CS alone kidneys (D). Actin was used as a loading control. Densitometry evaluation of each blot (normalized to actin) is shown on the right panel. Values were expressed as Mean ± S.E.M. (n = 4). Unpaired Student’s t test was used to compare the means between control and CS kidneys. One-way ANOVA followed by Tukey’s post-hoc test for multiple group comparisons was used to compare the means between sham, ATx, and CS/Tx kidneys; * indicates means are significantly different (P < 0.05) when compared to control or sham and # indicates means are significantly different (P < 0.05) when compared to ATx.

