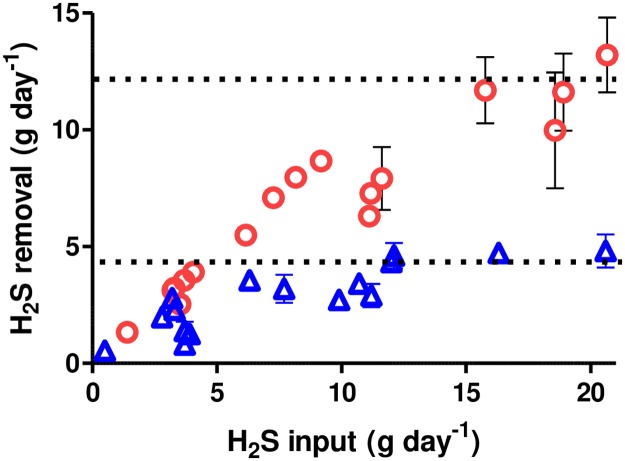
Fig 3. Hydrogen sulfide oxidation rates as a function of H2S loading rate in vertical and horizontal 65 L barrels.
Values are means of daily measurements from duplicate aerated barrels. Red circles, horizontal barrels. Blue triangles, vertical barrels. Vertical bars show standard error values. Dotted lines show estimated maximum removal rates corresponding to values shown in Table 1.

