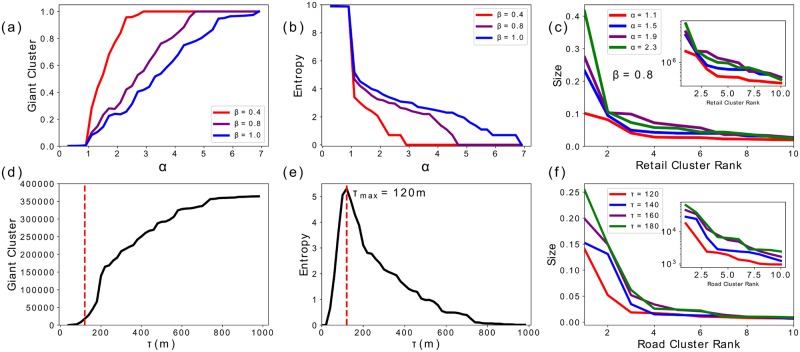
Fig 2. The top panels refer to the retail dynamics with β = {0.4, 0.8, 1.0}, while the bottom panels to the hierarchical percolation.
(a)-(d) The evolution of the size of the giant cluster, is presented, for increasing values of τ and α. (b)-(e) We show the evolution of the spatial entropy. Both quantities show a very similar behaviour in the two approaches. (c)-(f) We can see the distribution of the cluster (β = 0.8 for the retail model) that have an exponential form as shown in the insets.

