Fig 2.
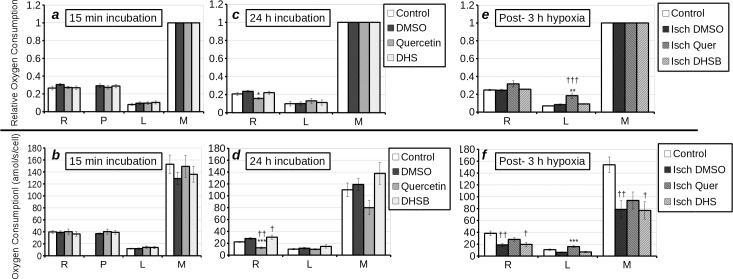
Respiratory parameters of whole (a-f) H9c2 cells treated with nothing (white bars), DMSO (dark grey bars) quercetin (25 μM) (grey bars) or DHS (1 μM) (light grey bars) as measured by high resolution respirometry. With respiratory control ratio (oxygen consumption relative to maximum oxygen consumption) in (a, c, e) and absolute rate in (b, d, f). (a, b) Cells were treated with compounds for 15 min (protocol A). (c, d) Cells were treated for 24 h with compounds prior to oxygraphy (protocol B). (e, f) Cells were subject to 3 h of hypoxia (with the exception of “control”- which consisted of untreated, normoxic control cells) followed by oxygraphy with treatment carried out during the 3 h of hypoxia (Protocol B). Processed respiratory parameters derived from measurements of routine (R), treated (P), leak (L), maximum (M) adjusted for residual respiration are displayed on the x-axis. It should be noted that “R” represents resting coupled state III respiration, “L” represents state IV respiration (treatment + oligomycin), and “M” represents uncoupled respiration (L+FCCP). Statistical significant differences from vehicle-control were denoted by * (p < 0.05), ** (p < 0.01) and *** (p < 0.001) and from untreated control by † (p < 0.05), †† (p < 0.01) and ††† (p < 0.001).

