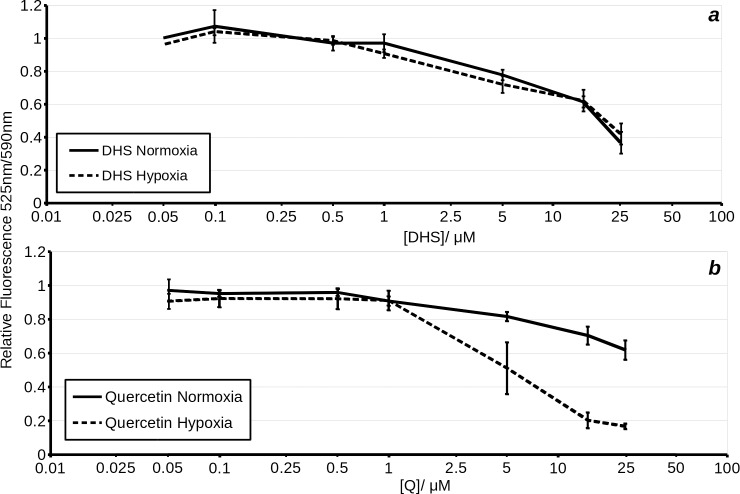
Fig 4.
Loss of mitochondrial membrane potential, as indicated by ratiometric fluorimetry with JC-1 following treatment with DHS (a) and quercetin (b). Cells were incubated with JC-1 for 1 h under hypoxia or normoxia, and subsequently measurements taken immediately. The solid line represents normoxia treated cells. The dashed line represents hypoxia treated cells.

