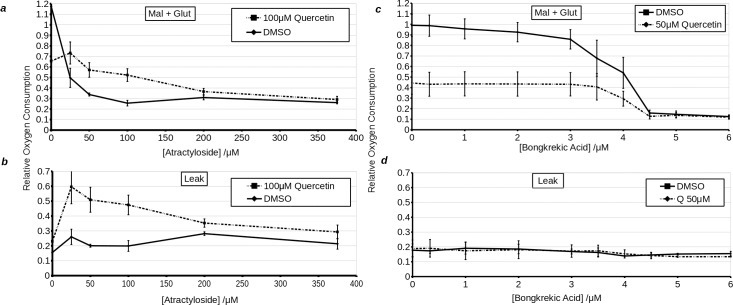
Fig 6.
Effects of 100 μM quercetin on complex I (malate + glutamate)- i.e. state III coupled (a, c) and leak- i.e. state IV (b, d) respiration in permeabilised H9c2 cells treated with variable concentrations of atractyloside (a, b) or titrated with bongkrekic acid (c, d). Solid line represents vehicle treated cells, while dashed line represents quercetin treated cells. X-axis shows the concentration of inhibitor in μM. Y-axis shows oxygen consumption relative to uncoupled respiration in DMSO treated cells.

