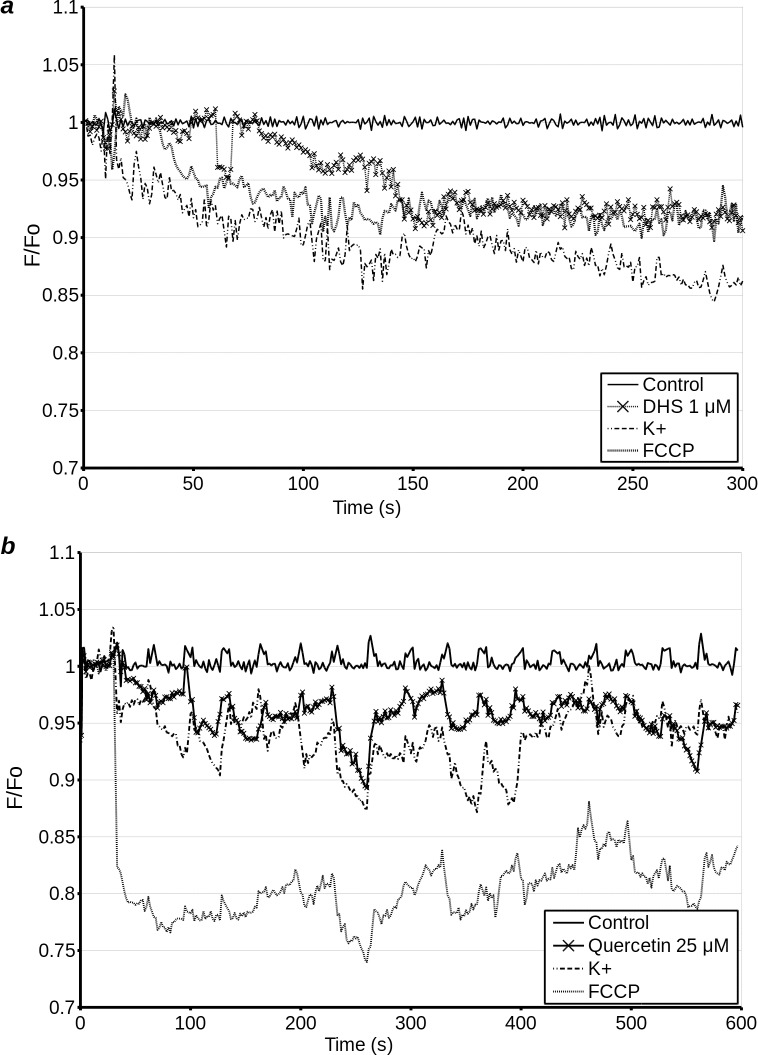
Fig 8. Plasma membrane potential in H9c2 cells transfected with Arclight potential sensor was measured by wide field microscopy over 300 s (treat 10 s after start of experiment).
Cells were treated with 5 μM FCCP (FCCP), 1 μM DHS (DHS), 1 μM ionomycin (Ionomycin) or 140 mM K+ (K), 10 s into the experiment (a). Confocal microscopy over 600 s (treatment 30 s after start of experiment) was used to establish the response of cells to treatment with quercetin. Cells were treated with 5 μM FCCP (FCCP), 15 μM quercetin (Q), 1 μM ionomycin (Ionomycin) or 140 mM K+ (K), 10 s into the experiment. (b). Due to the crowded nature of this figure, error bars are omitted for clarity (see supplementary data, Fig A in S1 File).

