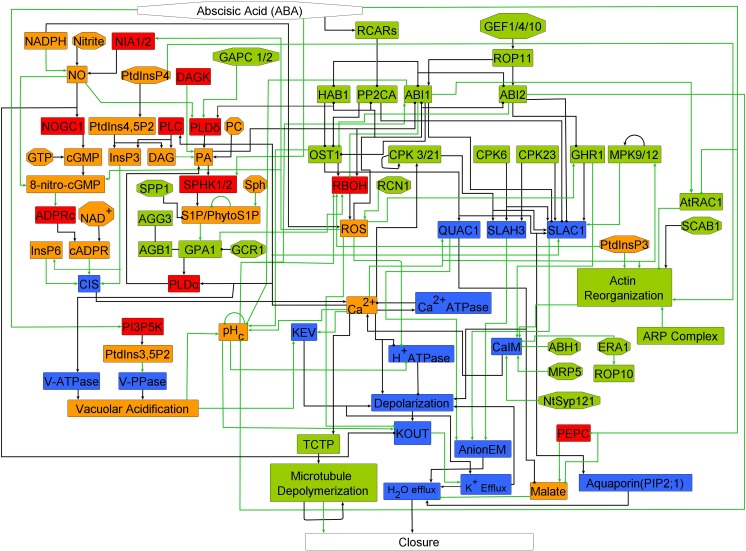
Fig 1. The network of abscisic acid (ABA)-induced stomatal closure.
Edges that end in an arrowhead indicate positive interactions or regulatory relationships. Edges that end in a filled circle indicate negative interactions or regulatory relationships. Source nodes (nodes with no incoming edges) are represented by octagons; the rest are rectangles. Edges that represent direct interactions or regulatory relationships are indicated with black, and green edges represent indirect or inferred relationships. The color of the nodes represents their function, as follows: enzymes (red), signaling proteins (green), membrane-transport related nodes (blue), and secondary messengers and small molecules (orange). The full names of network components corresponding to each node label are indicated in S3 Table, and biological justification for the edges is provided in S1 Table, S2 Table, and S1 Text.

