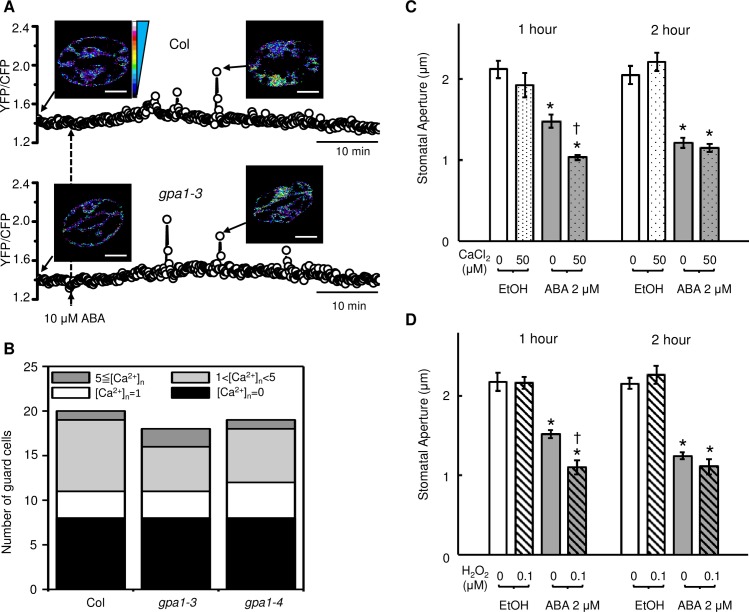
Fig 4. Experimental validation of model predictions.
A,B. Wild-type ABA response of Ca2+c oscillation in gpa1 null mutants. A. Representative ABA-induced oscillations in Ca2+c using Y3.6 fluorescent reporter. The fluorescence emission ratio of yellow fluorescent protein (YFP) to cyan fluorescent protein (CFP) (YFP/CFP) was calculated from YFP and CFP emission intensities. Pseudo-colored scale bar refers to both wild-type Columbia accession (Col) and gpa1 data. B. The numbers of guard cells exhibiting different types of ABA-induced Ca2+c oscillation in Col (n = 20), gpa1-3 (n = 18), and gpa1-4 (n = 19). C,D. ABA hypersensitivity in Arabidopsis thaliana stomatal closure upon external supply of Ca2+ or H2O2. Ca2+ or H2O2 alone does not induce closure at the low concentrations used here. C. CaCl2 (50 μM) accelerates ABA (2 μM)-induced stomatal closure in epidermal peels at 1 h. D. H2O2 (0.1 μM) accelerates ABA (2 μM)-induced stomatal closure in epidermal peels at 1 h. The asterisk above the sample indicates statistical significance (Student t test p < 0.05) between this sample and the same sample within the ethanol (EtOH) (solvent control) group; the dagger symbol indicates statistical significance (Student t test p < 0.05) between the 2 samples within the ABA treatment group. Data are mean ± SE of 3 independent replicates with 64 stomata per replicate. The numerical data (for B, C, and D) can be found in S1 Data.

