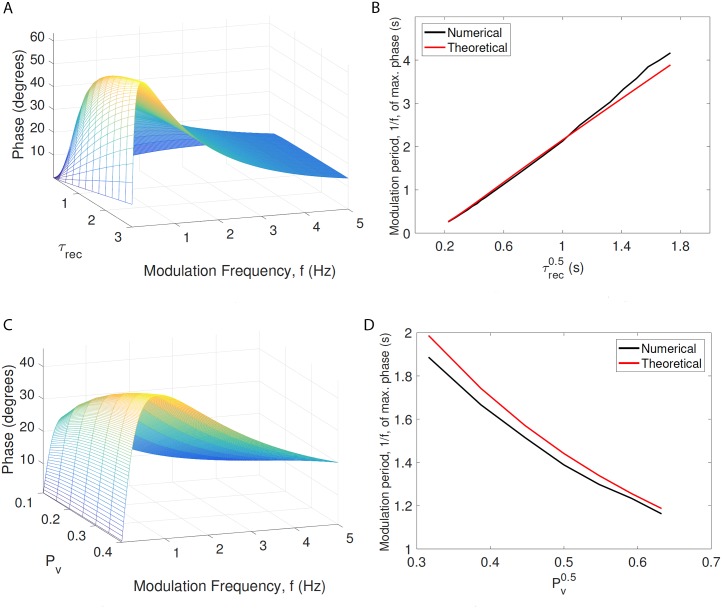
Fig 7. Theoretical analysis of resonance in phase change vs system dynamics.
Subfigures A and C show, for M = 512, that the mathematically predicted resonance in the phase change observed in Fig 6A depends strongly on the longest time constant in the system, τrec and on the vesicle release probability, Pv. Subfigures B and D show, for M = 512, that the period of the resonance has an approximately linear relationship with and . Together, τrec and Pv determine the time course of depression, which determines phase.

