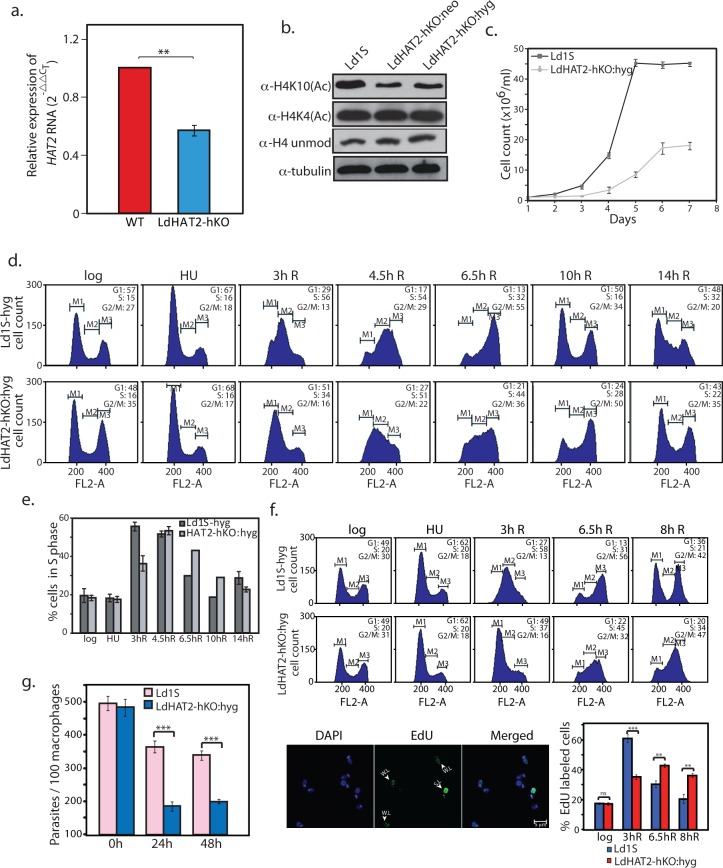
Fig 2. HAT2 acetylates H4K10 in vivo and its depletion causes growth and cell cycle defects.
a. Analysis of differential expression of LdHAT2 in LdHAT2-hKO versus wild type (WT) cells, by real time PCR analysis using 2-ΔΔCT method. Internal control: tubulin. Data is average of three experiments, error bars represent standard deviation. Two-tailed student’s t-test was applied: **p < 0.005 b. Western blot analysis of whole cell lysates of logarithmically growing wild type and LdHAT2-hKO promastigotes (3.5x10⁶ cell equivalents per lane). c. Growth analyses of LdHAT2-hKO cells in comparison with control. Three experiments were initiated in parallel. Data is the average of three experiments, error bars represent standard deviation. d. Comparative flow cytometry analysis of HU-synchronized LdHAT2-hKO and control cells: cells blocked at G1/S, then released into S phase. Time after release at which sampling was done is indicated above each column of histograms. 30,000 events analyzed at every time-point; M1, M2 and M3 gates indicate G1, S and G2/M phases. Percent of cells at different stages indicated in histogram insets. Experiment was performed three times; one data set shown here. e. Bar graph compares number of cells in S phase at different time-points. Average of three experiments is plotted, error bars depict standard deviation. f. HU-synchronized promastigotes were released into S phase, and aliquots of cells pulsed with EdU 3 hours, 6.5 hours and 8 hours after release (15 min pulses). Experiment was performed thrice. Upper panels: flow cytometry profiles of the cells at different intervals. Lower left panels: representative microscopy field with EdU-labelled and unlabeled cells. SL: strongly labeled. WL: weakly labeled. Lower right panel: bar chart comparing percent EdU-labeled cells at each time-point. ~ 100–120 cells were analyzed at each time-point. Data is average of three experiments, error bars—standard deviation. Two-tailed student’s t-test was applied: ns non-significant; **p < 0.005; ***p < 0.0005. g. Analysis of LdHAT2-hKO parasites within macrophages (Leishmania cycles between insect and mammalian host, existing in the mid-gut of insect as non-infective procyclic promastigotes and later in the salivary glands as infective metacyclic promastigotes, before being released into the mammalian host’s bloodstream via insect bite where they take up residence in macrophages and continue to multiply asexually). Parasites were scored by DAPI-staining of infected cells followed by Z-stack imaging using confocal microscopy. Three experiments were initiated in parallel. Bar chart represents average values of three experiments with error bars indicating standard deviation. Two-tailed student’s t-test was applied: ***p < 0.0005.

