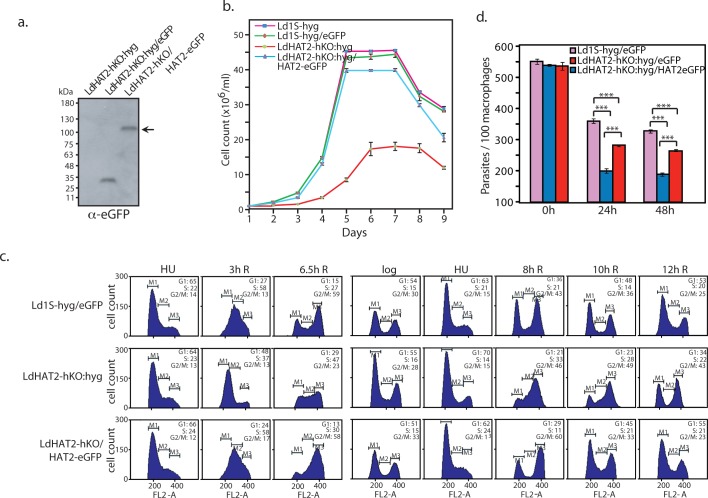
Fig 3. Ectopic expression of HAT2 rescues defects of HAT2-depleted cells.
a. Western blot analysis of whole cell lysates isolated from LdHAT2-hKO cells and LdHAT2-hKO cells expressing either eGFP or HAT2-eGFP (6x10⁷ cell equivalents per well) using anti-eGFP antibodies (1:2000 dilution). b. Growth analysis of rescue line LdHAT2-hKO:hyg/HAT2-eGFP in comparison with LdHAT2-hKO:hyg and control lines Ld1S-hyg and Ld1S-hyg/eGFP. Three experiments were initiated in parallel. Data shown is the average of three experiments, error bars represent standard deviation. c. Comparative flow cytometry analysis of HU-synchronized promastigotes of rescue line versus HAT2 heterozygous knockout and control line. Time after release at which sampling was done is indicated above each column of histograms. 30,000 events were analyzed at every time-point, and M1, M2 and M3 gates indicate G1, S and G2/M phases. The percent of cells at different cell cycle stages are indicated in the insets of each histogram. Data set of one of the three experiments performed is shown. d. Effect of ectopic expression of HAT2-eGFP on HAT2-hKO parasite propagation/survival within macrophages. Parasites were scored by DAPI-staining of infected cells followed by Z-stack imaging using confocal microscopy. Three separate experiments were initiated in parallel. Bar chart represents average values of three experiments with error bars indicating standard deviation. Two-tailed student’s t-test was applied: ***p < 0.0005.

