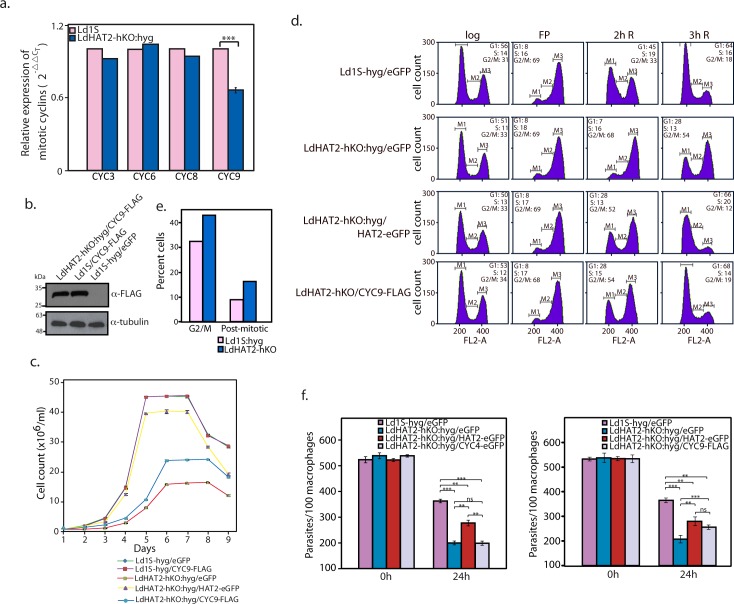
Fig 5. Down regulation of CYC9 causes G2M/post-mitotic defects in HAT2-depleted cells.
a. Analysis of differential expression of putative mitotic/post-mitotic cyclins in LdHAT2-hKO:hyg versus Ld1S by real time PCR analysis of RNA using 2-ΔΔCT method (in which tubulin served as internal control). Two-tailed student’s t-test was applied: ***p < 0.0005. b. Western blot analysis of whole cell lysates isolated from Ld1S-hyg cells expressing either eGFP or CYC9-FLAG and LdHAT2-hKO cells expressing CYC9-FLAG (1x10⁹ cell equivalents per well) using anti-FLAG antibodies (1:1000 dilution, Sigma Aldrich). 1/10 of each sample was loaded for tubulin control. c. Growth analysis of LdHAT2-hKO:hyg cells expressing CYC9-FLAG ectopically in comparison with LdHAT2-hKO:hyg/HAT2-eGFP rescue line, LdHAT2-hKO:hyg/eGFP heterozygous knockout line, control line Ld1S-hyg/eGFP, and Ld1S-hyg cells expressing CYC9-FLAG ectopically. Three separate experiments were initiated in parallel. Values plotted are the average of three experiments, error bars represent standard deviation. d. Flow cytometry analysis of flavopiridol-synchronized LdHAT2-hKO cells expressing CYC9-FLAG ectopically in comparison with LdHAT2-hKO cells expressing eGFP, LdHAT2-hKO:hyg/HAT2-eGFP rescue line, and control line Ld1S-hyg/eGFP. Data set of one of the three experiments performed is shown. e. Cells were examined microscopically after DAPI staining to determine the percent of cells in G2/M (2N1K and 1N2K) and the number of post-mitotic cells (2N2K). f. Effect of ectopic expression of CYC4-eGFP (left panel) or CYC9-FLAG (right panel) on HAT2-hKO parasite propagation/survival within macrophages. Parasites were scored by DAPI-staining of infected cells followed by Z-stack imaging using confocal microscopy. Three separate experiments were initiated in parallel. Bar chart represents average values of three experiments with error bars indicating standard deviation. Two-tailed student’s t-test was applied: *p < 0.05, **p < 0.005, ***p < 0.0005, ns: not significant.

