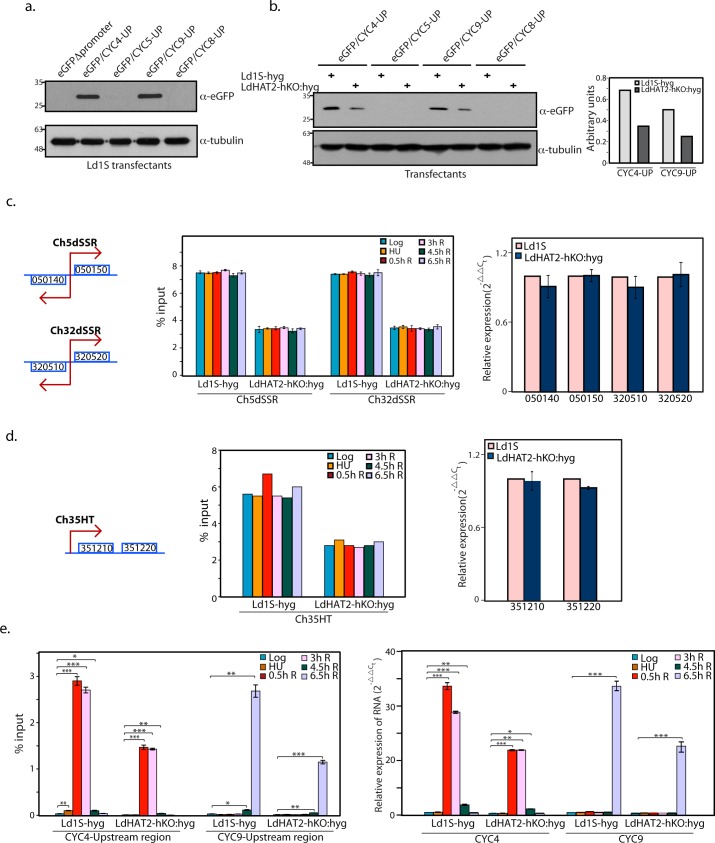
Fig 7. CYC4 and CYC9 promoters are activated in cell cycle-dependent manner.
a. Western blot analysis of whole cell lysates isolated from Ld1S transfectants (6x10⁸ cell equivalents per well)—using anti-eGFP antibodies (1:2000 dilution). 1/12 of each sample was loaded for tubulin control. b. Left panel—Western blot analysis of whole cell lysates isolated from Ld1S-hyg and LdHAT2-hKO transfectants (2x10⁸ cell equivalents per well)—using anti-eGFP antibodies (1:2000 dilution). 1/8 of each sample was loaded for tubulin control. Right panel—ratio of eGFP: tubulin in case of reactions showing eGFP expression, as determined by quantification using ImageJ 1.46r software (Wayne Rasband, NIH, USA). c, d, e. Left panels: ChIP analyses of HU-synchronized Ld1S-hyg and LdHAT2-hKO cells using anti-H4acetylK10 antibodies, by real time PCR coupled to percent input method. Analyses were carried out at various time-points, as indicated at upper corner of boxes. ChIP analyses were carried out thrice. In each experiment real time PCR reactions were set up in triplicate, and average value determined. Bar chart values presented here represent the mean of the three averages. Error bars indicate standard deviation. Two-tailed student’s t-test was applied: *p < 0.05, **p < 0.005, ***p < 0.0005. Right panels: Analysis of expression of genes in Ld1S-hyg and LdHAT2-hKO:hyg cells by real time PCRs using 2-ΔΔCT method (tubulin served as internal control). Three rounds of analyses were carried out, and in each round reactions were set up in duplicate and the average determined. Bar chart values represent the mean of the three averages. Error bars indicate standard deviation. Two-tailed student’s t-test was applied: *p < 0.05, **p < 0.005, ***p < 0.0005. c. Left panel: ChIP analysis of regions within chromosome 5 and chromosome 32 dSSRs (Ch5dSSR and Ch32dSSR respectively) Right panel: Gene expression analysis of genes coupled to the dSSRs that were analyzed by ChIP, in logarithmically growing cells. 050140:putative nucleolar RNA helicase II; 050150:hypothetical protein; 320510:hypothetical protein; 320520: Ras-related protein Rab4. d: Left panel: ChIP analysis of chromosome 35 HT region. Right panel: Gene expression analysis of genes coupled to the HT that was analyzed by ChIP, in logarithmically growing cells. 351210:pre-mRNA splicing factor ATP-dependent RNA helicase; 351220:arginine-rich protein. e. Left panel: ChIP analysis of regions upstream of CYC4 and CYC9 genes. Representation of the data using a log10 y-axis is shown in S6D Fig. Right panel: Analysis of expression of CYC4 and CYC9 in HU-synchronized cells, at various time-points as indicated at upper corner of box. Flow cytometry profiles of cells are presented in S6E Fig. Relative expression was analyzed with reference to expression in logarithmically growing asynchronous Ld1S-hyg cells.

