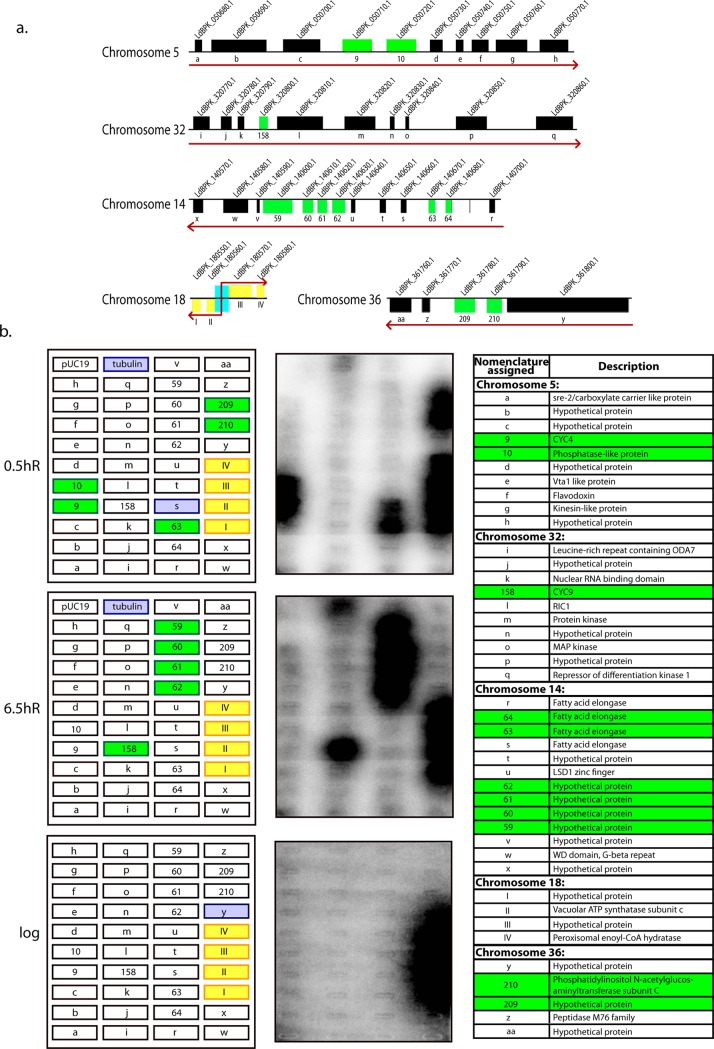
Fig 8. Nuclear run-on assays performed with Ld1S promastigotes.
a. Schematic representation of the genomic locations of genes being analyzed in run-on transcription assays, adapted from Leishmania donovani genomic map available in GeneDB (www.genedb.org; [45]). Genes marked as green boxes are downregulated in HAT2-depleted cells. Genes marked as yellow boxes indicate genes immediately adjacent to a dSSR. Red arrows indicate direction of transcription of PTUs. Downregulated genes carry a designated arabic numeral that corresponds to their serial number in S4 Table, and all other genes carry a designated alphabet. b. Left panels: schematic representations of slot blots indicating the blot position of each gene that was analyzed. At each time-point, slots corresponding to transcriptionally activated genes which matched with genes that were downregulated in HAT2-depleted cells are marked green while slots corresponding to transcriptionally activated genes that are linked to a dSSR are marked yellow. Other activated genes are marked mauve. Positive control: tubulin. Negative control: pUC19 plasmid with no insert. Centre panels: phosphorimaging of blots after hybridization with radiolabeled nascent RNA isolated from nuclei. Shorter and longer exposures are presented in S7 Fig. The table lists the description of all genes analyzed.

