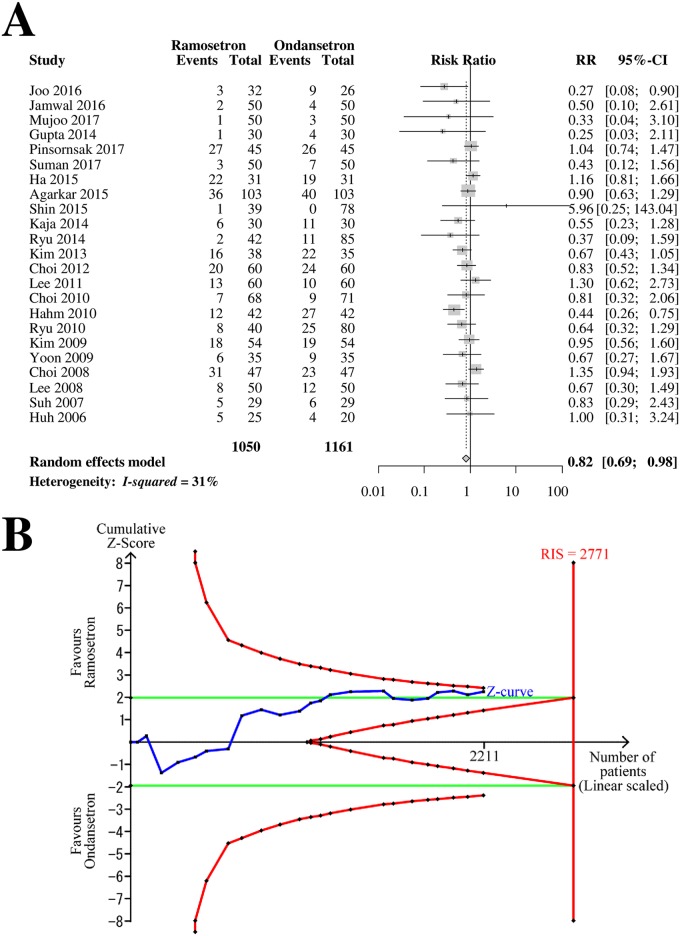
Fig 2. Forrest plot and trial sequential analysis of postoperative nausea (PON) in the early period.
(A) Forrest plot. RR, risk ratio; CI, confidence interval. (B) Trial sequential analysis. Risk of type I error was maintained at 5% with 90% power. The variance was calculated from data obtained from the trials included in this meta-analysis. A clinically meaningful anticipated RR of the early-period PON was set at 0.75.

