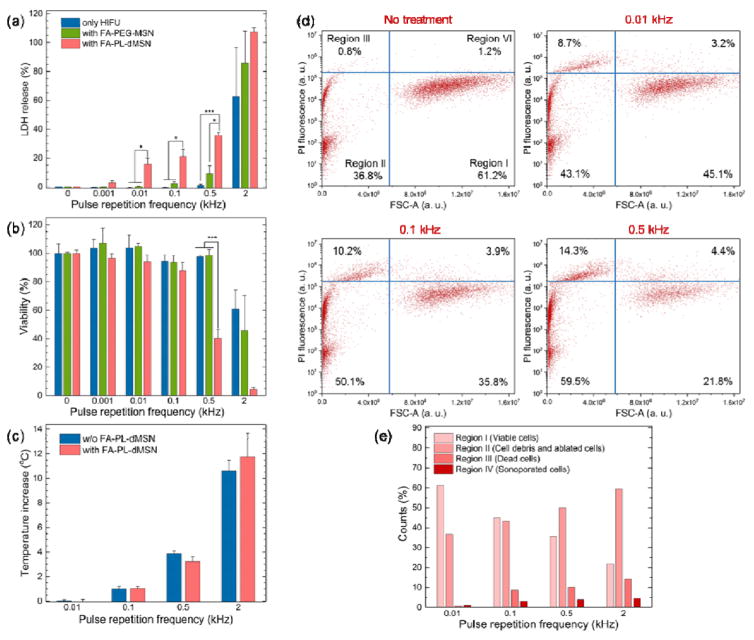
Figure 4.
Cellular damage by the internalized ultrasound agents after HIFU insonation. a) LDH and b) XTT assays of MDA-MB-231 cells, which were pre-incubated with or without FA-PL-dMSN (100 μg mL−1) or FA-PEG-MSN (100 μg mL−1) overnight, followed by 30 s HIFU exposure (pulse duration of 10.9 μs, 10.6 MPa) at different pulse repetition frequencies. c) Temperature raise of PBS containing or not containing FA-PL-dMSN (100 μg mL−1) after 30 s of HIFU exposure (pulse duration of 10.9 μs, 10.6 MPa) at different pulse repetition frequencies. d) Propidium iodide (PI) fluorescence versus Forward Scatter-Area (FSC-A) plots of the MDA-MB-231 cells pre-incubated with FA-PL-dMSN (100 μg mL−1) for overnight and exposed to after HIFU (pulse duration of 10.9 μs, 10.6 MPa) for 30 s at different pulse repetition frequencies. We defined four regions in the flow cytometry plots; viable cells (region I), ablated cells (region II), dead cells (region III), and sonoporated cells (region IV). e) Graph showing counts (%) for each region in the flow cytometry plot in d). Error bars = 1 standard error of the mean (SEM) for a) and b) and 1 SD for c), studies were run in triplicate. According to Student’s t-test, *p < 0.05 and ***p < 0.0001.

