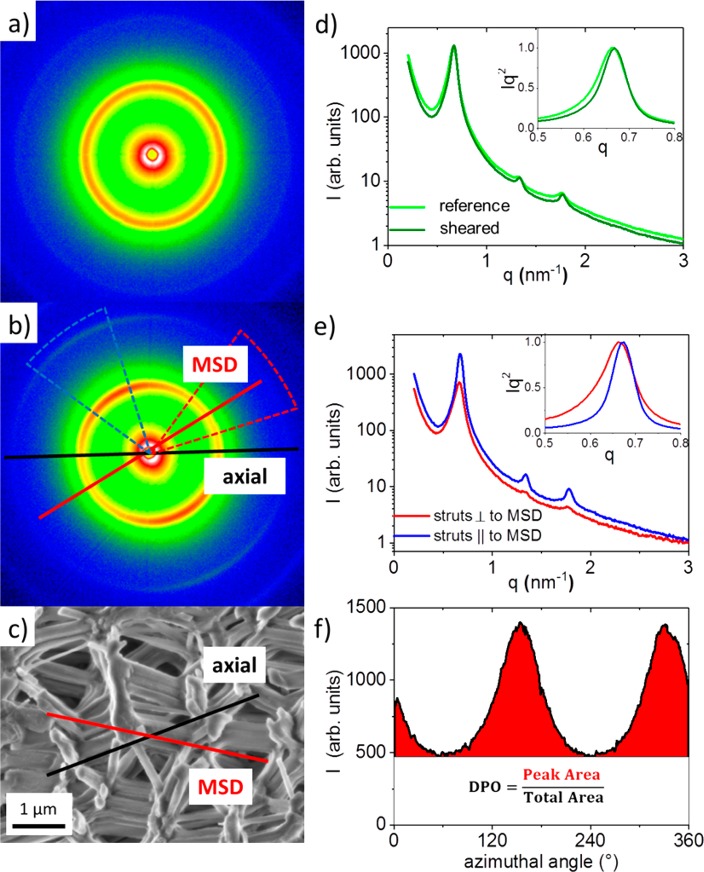
Figure 2.
2D scattering patterns of (a) the reference sample and (b) the sheared sample. (c) Representative SEM image of the sheared sample showing the preferred orientation of struts (main strut direction, MSD), which is about 35° tilted from the macroscopic sample cylinder axis, i.e., the axial direction. (d) Comparison of the radially averaged scattering profiles from (a) and (b). (e) Scattering curves from the sheared sample integrated in a narrow sector (±20°) around the intensity minimum (MSD direction) as well as around the intensity maximum (perpendicular to the MSD direction). The insets in (d) and (e) show the main Bragg-reflection in a Kratky Plot31 normalized to the same height. (f) Azimuthal integration in a narrow q-range around the main Bragg peak of the sheared sample. The degree of preferred orientation (DPO) is defined by the area of the peak divided by the total area under the azimuthal intensity distribution.

