Figure 3.

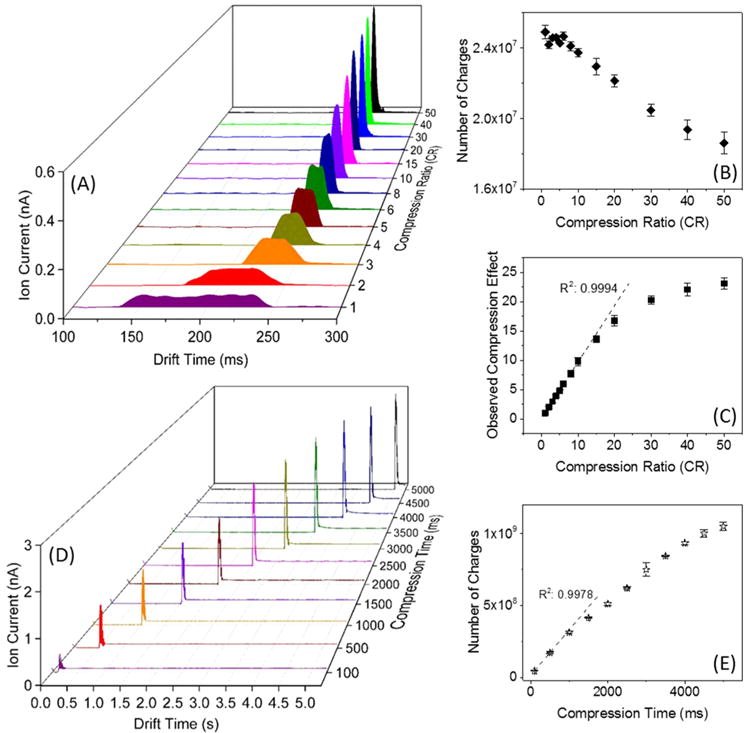
Compressing an ion band: (A) Ion currents measured at the quadrupole following the SLIM at different CRs for 100 ms long ion band injection events. (B) Number of charges measured at the quadrupole as a function of CR. (C) The observed compression vs selected CR. Compressing a continuous ion beam: (D) Ion current at the quadrupole after the SLIM for continuously introduced ions from ESI of the low concentration Agilent tuning mix solution for various compression times and CR = 200. The increased baseline following the detected ion band is due to the resumption of the continuously introduced ions. (E) Number of charges detected at the quadrupole as calculated from the detected ion pulse areas.
