Figure 3. Specific time-of-day differences in physiology and in dynamics of Non-Structural Carbohydrates (NSC) were observed in B. rapa R500 plants subjected to mild drought relative to control plants.
(A) Photosynthetic rate, A (μmol CO2 m−2s−1) of well-watered controls (green) and mild droughted (orange) plants. (B) Stomatal conductance, gs (mmol H2O m−2s−1) of well-watered controls (green) and mild droughted (orange) plants. (C) Maximum efficiency of PSII in light adapted conditions, Fv’/Fm’ of well-watered controls (green) and mild droughted (orange) plants. (D) NSC accumulation in well-watered (green) and mild droughted (orange) plants. NSC content is expressed as dry weight and refers to the sum of leaves and cotyledon biomass. Tissue collection was carried out every 4 hr during the 2 day time course except for ZT9 when no sugar extraction was performed. White and black bars and gray shading represent the dark period in the growth chambers (14 hr/10 hr; Day/Night). All represented values are averages of at least eight replicates ± SE, asterisks represent a significant difference (p<0.01) between treatments. See Figure 3—figure supplement 1.

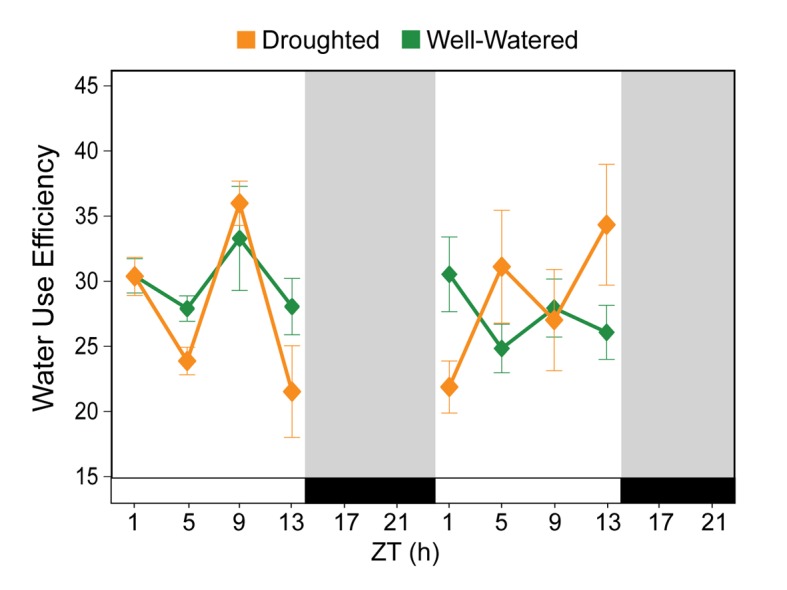
Figure 3—figure supplement 1. Water use efficiency (WUE) is not an accurate measure of plant response to drought.