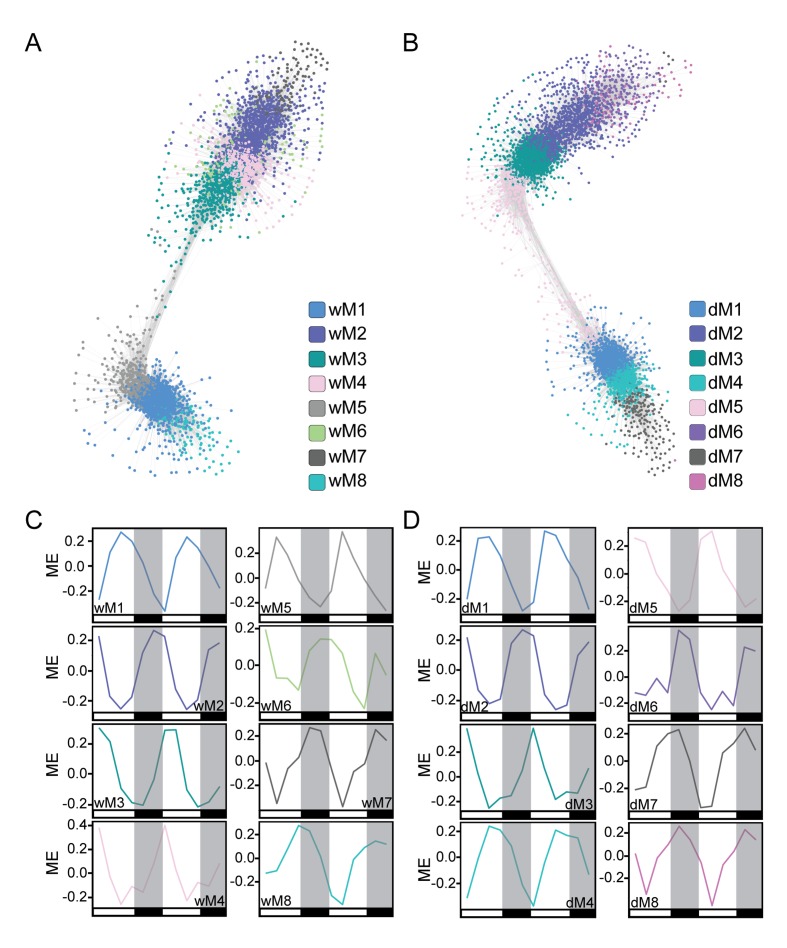
Figure 4. Co-expression network analysis identifies modules of temporally regulated genes with similar phase patterns.
(A and B) The well-watered (A) and droughted (B) networks are shown with gene nodes colored by module membership. Network visualization was done in Cytoscape using a ForceDirected layout with an edge threshold cutoff of 0.1. Modules with significant overlap of gene membership between the well-watered and drought networks are similarly colored. (C and D) The module eigengene (ME) plots for the well-watered (C) and droughted (D) modules reveal temporal regulation of the top eight modules in each network containing ~80–85% of expressed genes. The ME plots are colored based on the modules in the network visualizations. White and black bars along the x-axis represent the day and night time points respectively.

