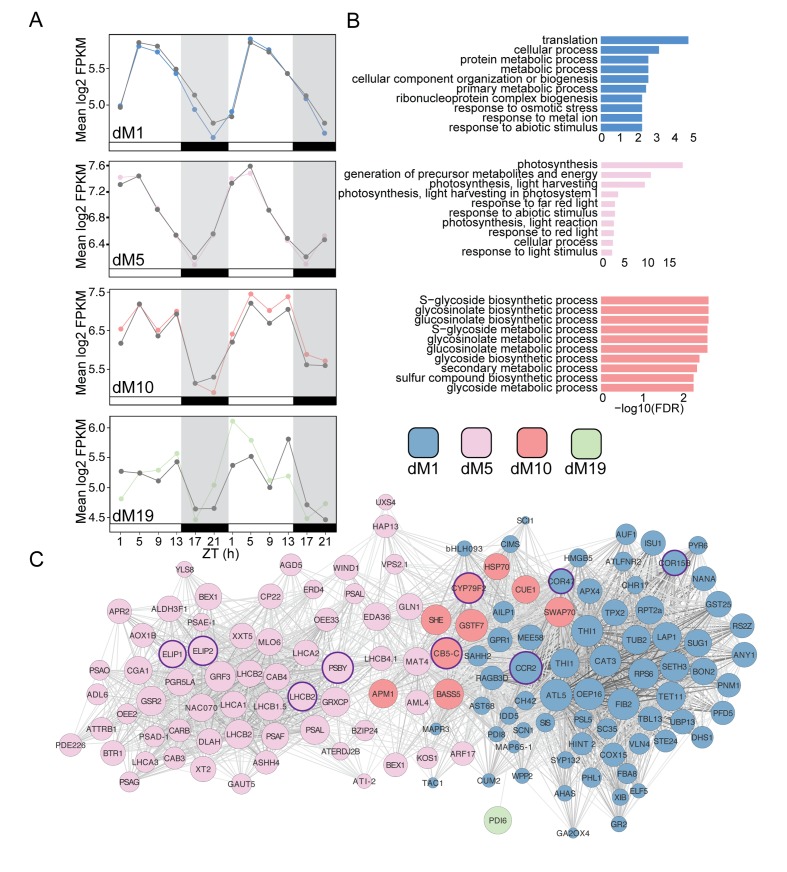
Figure 8. Modules positively correlated with physiology are associated with metabolism and light harvesting processes.
(A) Mean log2 FPKM expression profiles of genes in the dM1, dM5, dM10, and dM19 modules that are positively correlated with stomatal conductance and identified by JTK-CYCLE as having an amplitude change between well-watered and droughted samples. Grey lines are always well-watered. White and black bars along the x-axis represent the day and night time points, respectively. (B) Top 10 associated GO terms for dM1 (top), dM5 (middle), and dM10 (bottom). (C) Genes identified in the dM1, dM5, dM10, and dM19 modules with known Arabidopsis orthologs are shown in the network view. Nodes are colored based on module and size based on module membership. The larger nodes are highly connected within a module and have greater ‘hubness’. The nodes circled in purple were validated by Nanostring.

