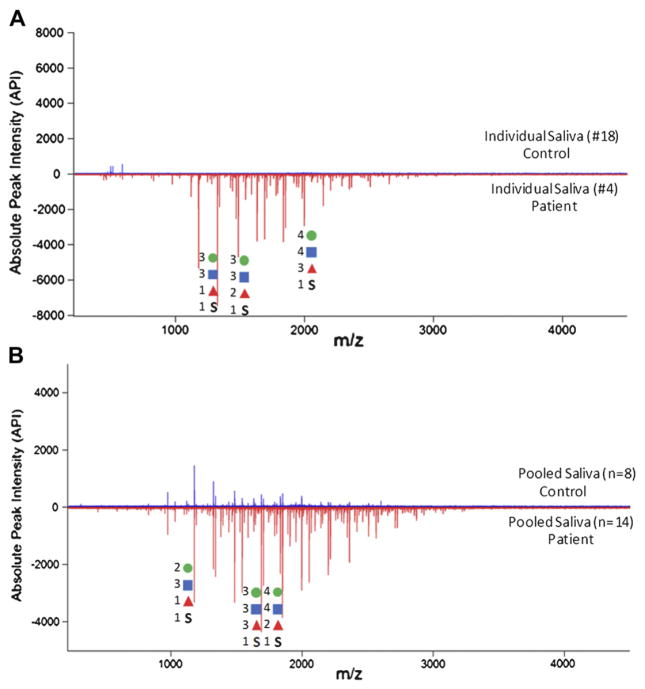
Figure 2.
(A) O-glycan profile of an individual saliva sample. Top part of the graph shows the control saliva sample (#18) while bottom shows patient saliva (#4). (B) In-depth profiling of O-glycans released from pooled control (n=8) and roseatic patient saliva (n=14). All mass spectra were analyzed in the negative ion mode. Sulfated glycans are abundant in saliva from roseatic patients. Individual glycan profiles are very similar to those observed in pooled samples.

