
Figure 3.
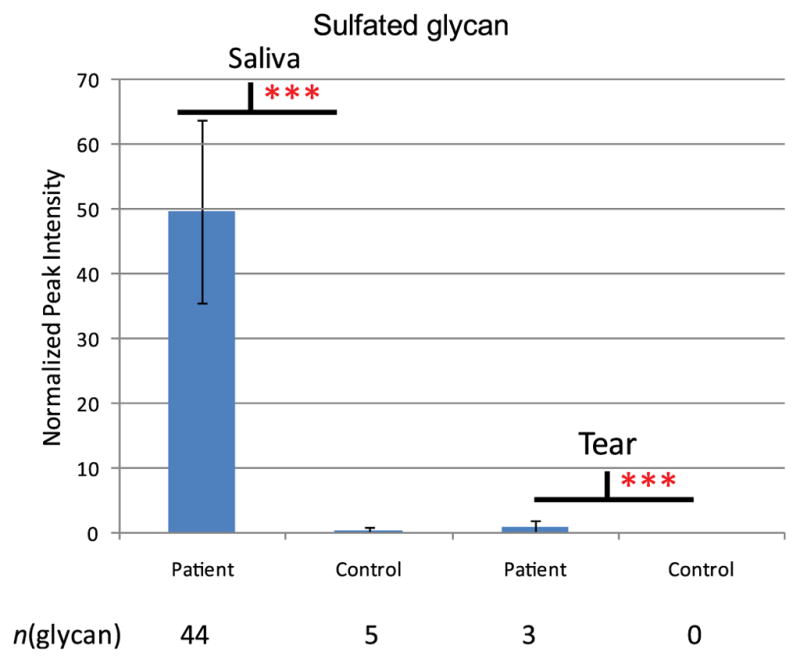
Sulfated glycan expression between patient and control group. Normalized intensities of glycans found in saliva and tear of control and ocular rosacea patient group were compared. T-test was performed and *** represents significant difference (p<0.005) between control and patient group.