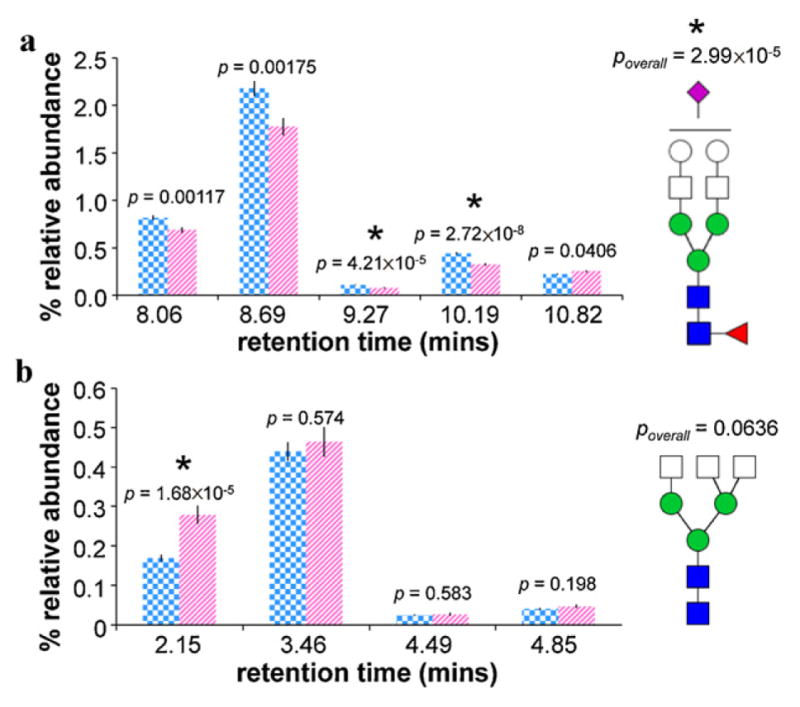
Fig. 5.

(a) Average relative abundances and standard errors associated with five structural isomers of Hex5 HexNAc4 FucNeuAc; and (b) average relative abundances and standard errors associated with four structural isomers of Hex3 HexNAc5 in cancer cases (striped pink, n = 48) and controls (checkered blue, n = 46). T-test p-values are shown for each isomer as well as for the overall composition. Note that error bars are present for all data, though extremely small. *Denotes a statistically significant difference between cancer cases and controls. (For interpretation of the references to color in the artwork, the reader is referred to the web version of the article.)
