
Figure 2. Multivariable adjusted hazard ratio for end-stage renal disease by BMI and waist circumference (WC) categories.
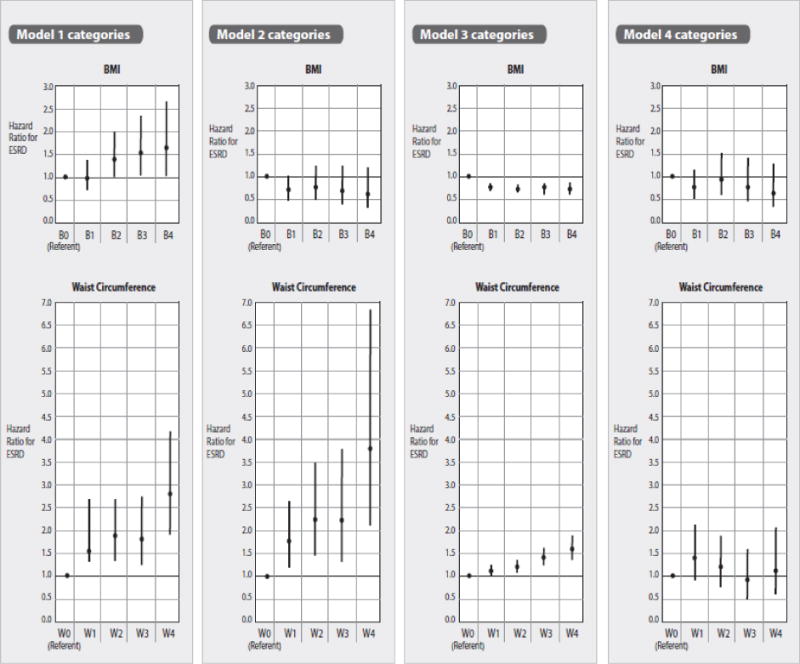
B0, B1, B2 B3, B4 corresponds to BMI in kg/m2 18.5–24.9 (referent group), 25.0–29.9, 30.0–34.9, 35.0–39.9 and ≥ 40. W0, W1, W2, W3, W4 corresponds to waist circumference cm < 80 in women and < 94 in men (referent group), 80–87.9 in women and 94–101.9 in men, 88–97.9 in women and 102–111.9 in men, 98–107.9 in women and 112–121.9 in men, and ≥ 108 in women and ≥ 122 in men. Model 1 adjusted for age, gender, race, sampling region, household income and education. Model 2 added WC or BMI as a covariate to Model 1; Model 3 added presence of co-morbid conditions (coronary heart disease, stroke, hypertension and diabetes) and eGFR to Model 2. Model 4 added log transformed baseline ACR to Model 3.