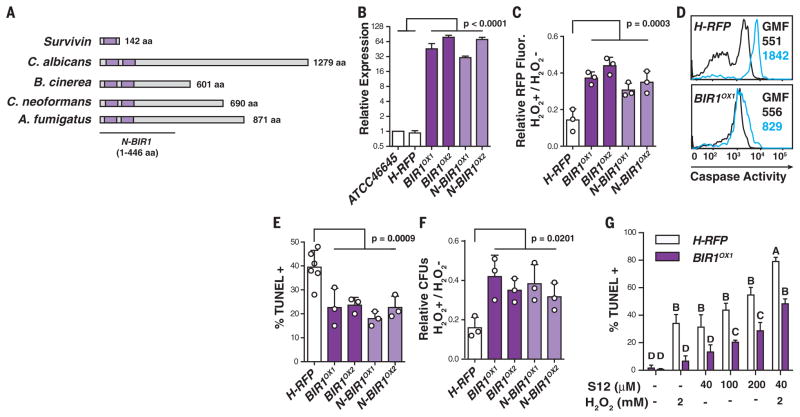
Fig. 2. BIR1 regulates conidial A-PCD.
(A) Organization of BIR domains (purple) in human Survivin, Candida albicans CaBIR1, Botrytis cinerea BcBIR1, Cryptococcus neoformans CnBIR1, and Aspergillus fumigatus AfBIR1. (B) BIR1 mRNA expression in the indicated strains (white, control strains; dark purple, full-length BIR1OX strains; light purple, N-terminal BIR1OX strains) normalized to β-tubulin and gpdH and expressed as the mean relative change. (C to G) Swollen conidia [(C), (E), and (F)] or germlings (D) were exposed to 0 or 5 mM H2O2 and analyzed for (C) RFP intensity, (D) caspase activity (0 mM H2O2, black lines; 5 mM H2O2, blue lines; GMF, geometric mean fluorescence), (E) TUNEL signal, and (F) CFUs. (G) TUNEL signal in H-RFP and BIR1OX1 swollen conidia after S12 and H2O2 exposure, as indicated. [(C), (E), and (F)] Each circle represents data pooled from three replicates in one experiment. The bar graphs indicate mean + SD of two (B) or three to six [(C) and (E) to (G)] independent experiments, and [(C) and (F)] data are normalized to the control condition (0 mM H202 condition). Statistical analysis: One-way [(C), (E), and (F)] or two-way (G) analysis of variance, followed by Dunnett’s [(C), (E), and (F)] or Sidak’s (G) test for multiple comparisons. (G) Different letters indicate groups that are statistically different (P < 0.05).

