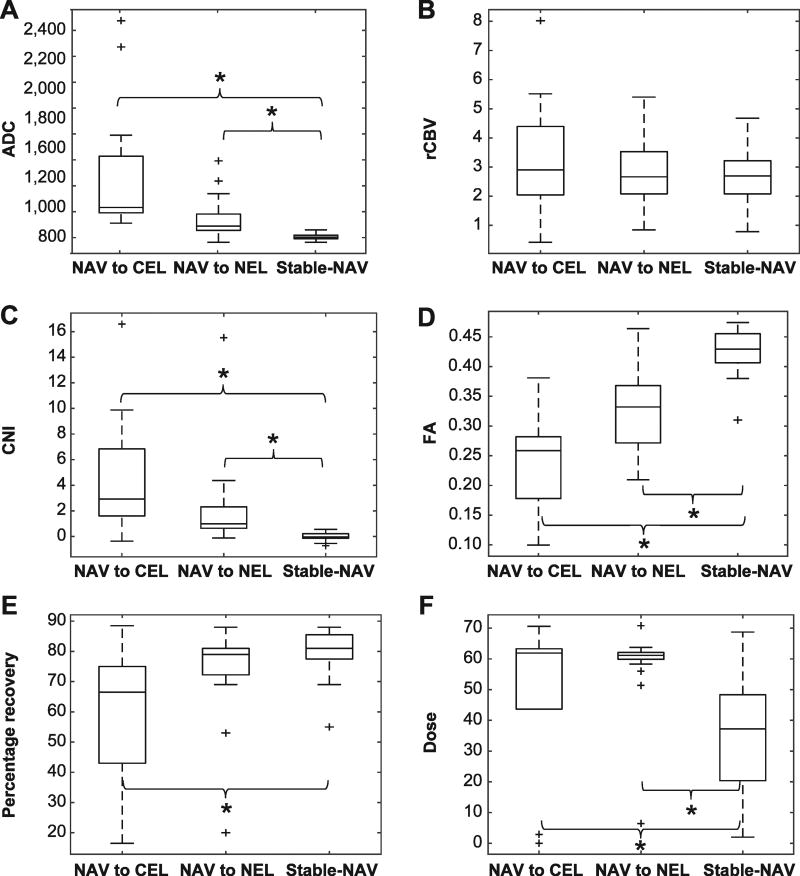
FIG 3.
Box plots of the median value of each patient’s voxels, by parameter, that progress from the NAV at baseline to the CEL and NEL, and remain as stable NAV, respectively, at recurrence. Panel A: Apparent diffusion coefficient; panel B: percentage recovery; panel C: choline to NAA index; panel D: fractional anisotropy; panel E: relative cerebral blood volume; and panel F: radiation dose.

