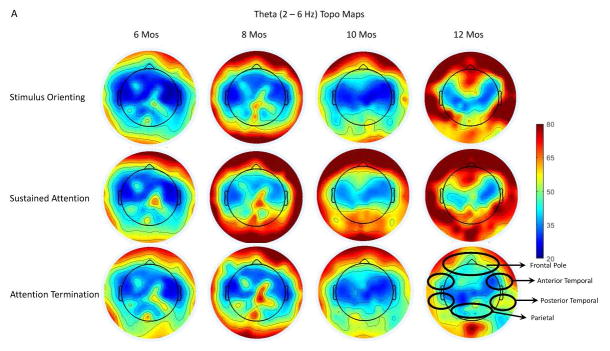
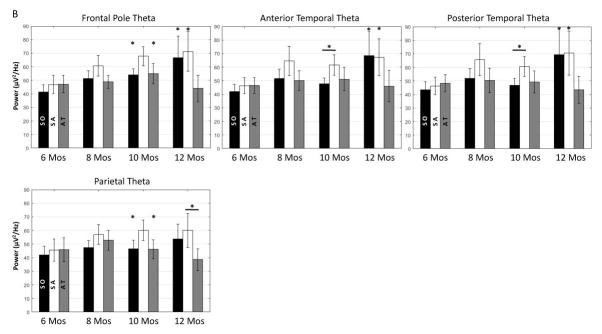
Figure 2.
Illustration of infant theta activity on the scalp during different attention phases across ages. A. Topographical maps for the distribution of the theta PSD separately during the three attention phases for all four age groups. Participants at 8, 10 and 12 months showed greater theta PSD in the frontal, temporal, and parietal regions. Also, there was an increase in the PSD compared to the two younger ages, especially for sustained attention. B. Bar graphs for the theta PSD in the Frontal Pole, Anterior Temporal, Posterior Temporal, and the Parietal clusters across ages as a function of attention phases: stimulus orienting (SO; black), sustained attention (SA; white), attention termination (AT; gray). *P < 0.05.


