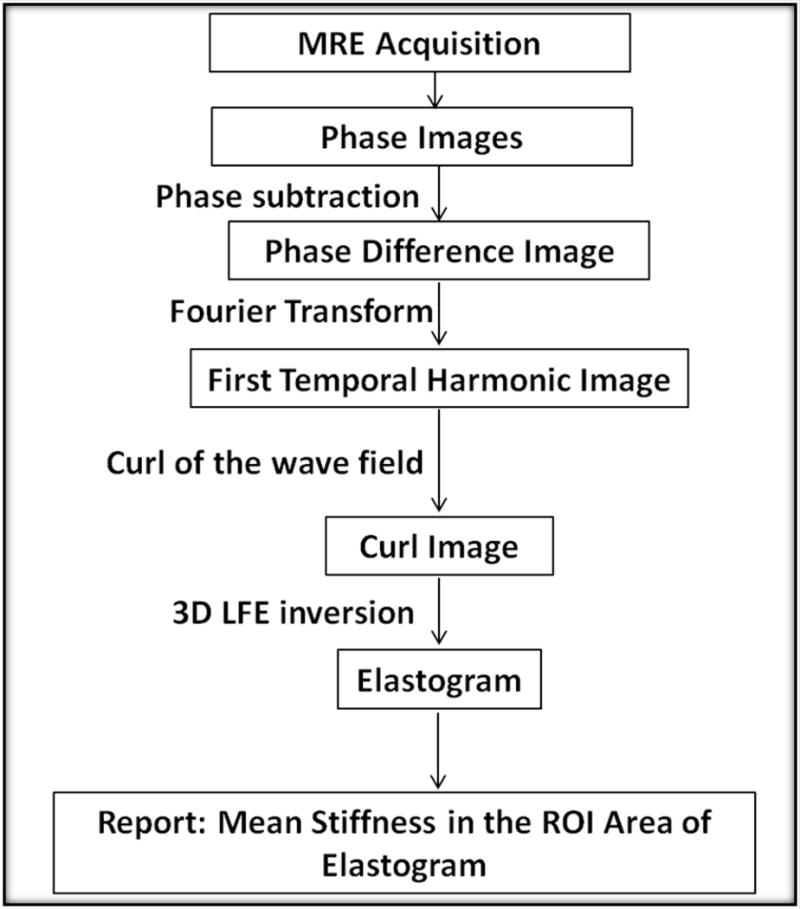
Figure 4.

MRE Inversion flow chart. MRE acquired images are converted into elastograms through multiple steps, including applying the curl operator to the first temporal harmonic image. Regions of interest are drawn onto magnitude image and copied onto the elastogram. The curl images are also used to generate OSS-SNR maps on the 140 Hz and the no-motion images.
