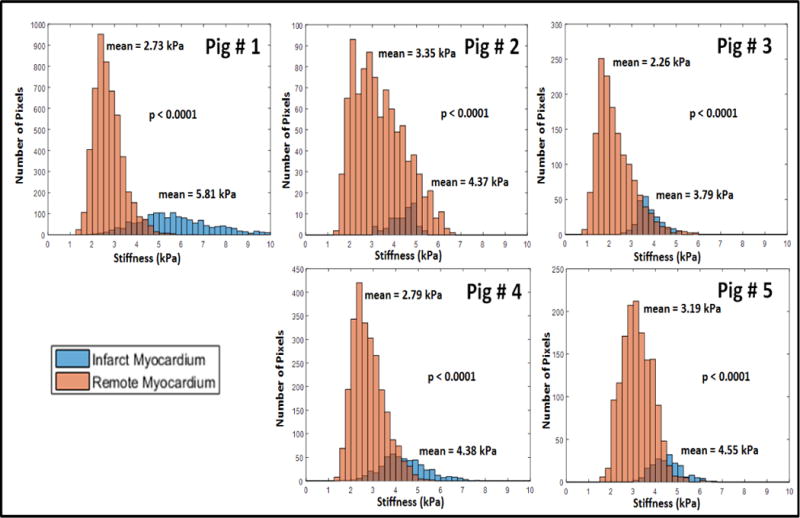
Figure 9.

Histogram of pixel-wise stiffness estimates for the infarct and remote ROI’s used for the five different pigs analyzed in this study. X-axis shows the stiffness (kPa) and Y-axis represents number of pixels. The mean values of the remote and infarct stiffness are reported near the corresponding histograms. Infarcted myocardium was significantly stiffer (p <0.0001) than the remote myocardium in each of the 5 pigs. There are more pixels for the remote ROI as the infarct ROI’s were relatively smaller.
