
Figure 2.
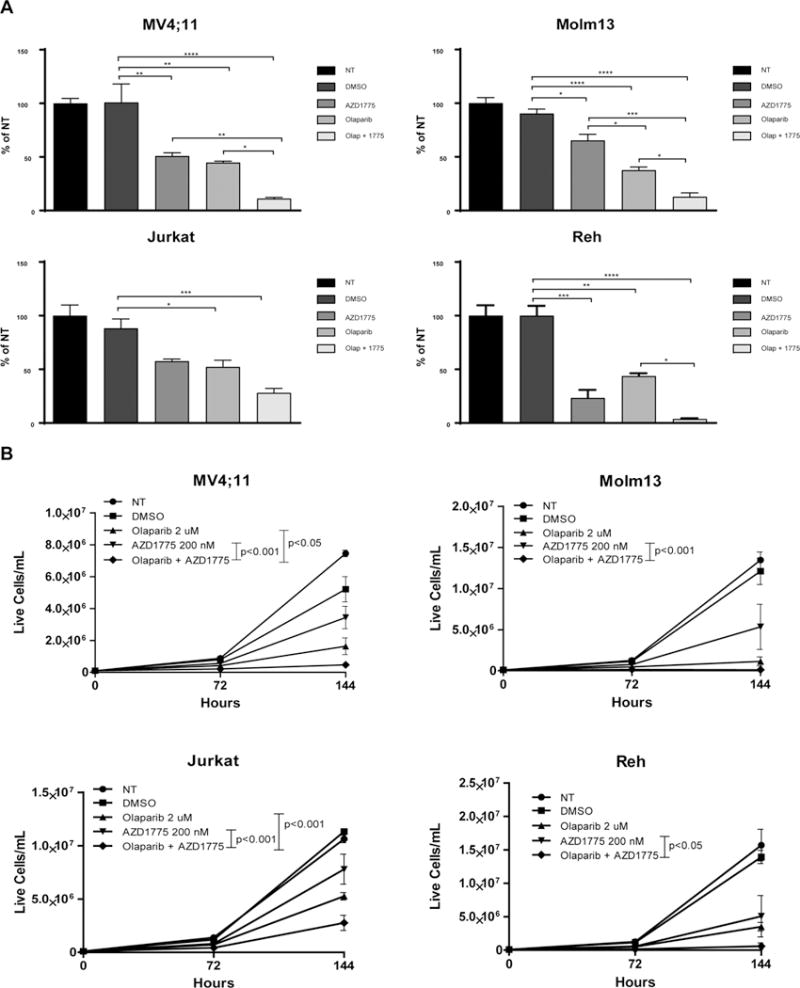
AZD1775 enhances the anti-proliferative effect of olaparib on leukemia cells. A. Relative numbers of viable cells treated with DMSO (vehicle control), olaparib (2 uM), and/or AZD1775 (200 nM) for 72 hr. Viable cell counts are normalized to cells receiving no treatment (NT). Results are shown as mean ± SEM from three independent experiments. *, P < 0.05. **, P < 0.01. ***, P < 0.001, ****, P < 0.0001. B. Live cell number of NT AML and ALL cell lines or treated with the indicated concentrations of DMSO (vehicle control), olaparib, and/or AZD1775 for 72 hr, removed from drug and cultured in fresh media for another 72 hr. Results are displayed as mean ± SEM from three independent experiments. Displayed P values were calculated by two-way ANOVA.