. Author manuscript; available in PMC: 2018 Oct 1.
Published in final edited form as: Mol Cancer Ther. 2017 Jun 15;16(10):2201–2214. doi: 10.1158/1535-7163.MCT-16-0924

Figure 1. Expression of EGFR in bladder cancer tissues and cell lines.

Figure 1

A. Staining intensity of bladder cancer tissue cores by T stage. Tissue microarrays BL2081 and BL806 (Biomax) were analyzed for presence of EGFR expression using anti-EGFR antibody (CST No. 4267). Each sample was graded for staining as follows: 0=<10% of cells positive (black); 1=10–24% (maroon); 2=25–49 % (red); 3=50–74% (firebrick); 4=75–100% (pink). There is no relationship between EGFR staining and T stage.

B. Staining intensity of non-squamous versus squamous bladder cancers. About 94% of bladder SCC cores in our analysis showed very high expression of EGFR (staining intensities 3 and 4) as compared to non-squamous bladder cancer cores.

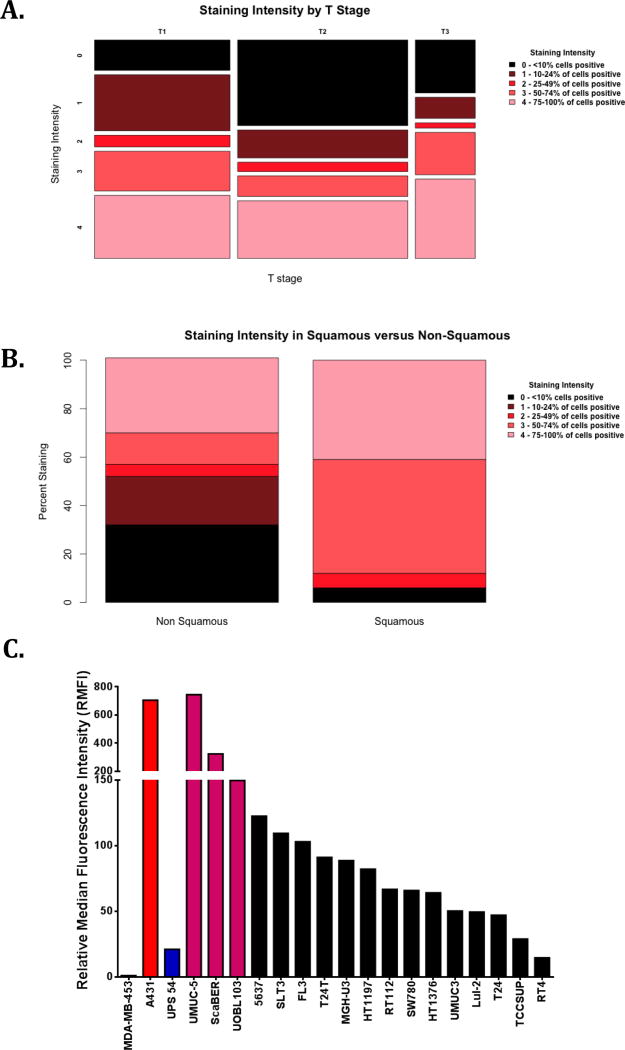
C. Surface expression of EGFR on various cell lines. Surface expression of EGFR was studied using flow cytometry. Single cell suspension of cell lines was incubated with PE-tagged rat mAB to human EGFR or PE tagged rat IgG2a, kappa mAB (isotype control). The experiment was carried out at 4°C. At the end of 30 minutes of incubation, the cells were washed and analyzed on the flow cytometer. The relative median fluorescence intensity (RMFI) for each cell line was calculated by the following formula:
RMFI=Median Fluorescence Intensity (AntiEGFR)Median Fluorescence Intensity (Isotype Control)
RMFI of various cell lines including the “Gold Standard” for EGFR expression (A431 (red bar)), a normal urothelial cell line (UPS54 (blue bar)), and bladder SCC lines (UMUC5, ScaBER, UOBL103 (pink bar)) are represented in the figure. RMFIs of all urothelial cancer cell lines tested are represented in solid black bars.