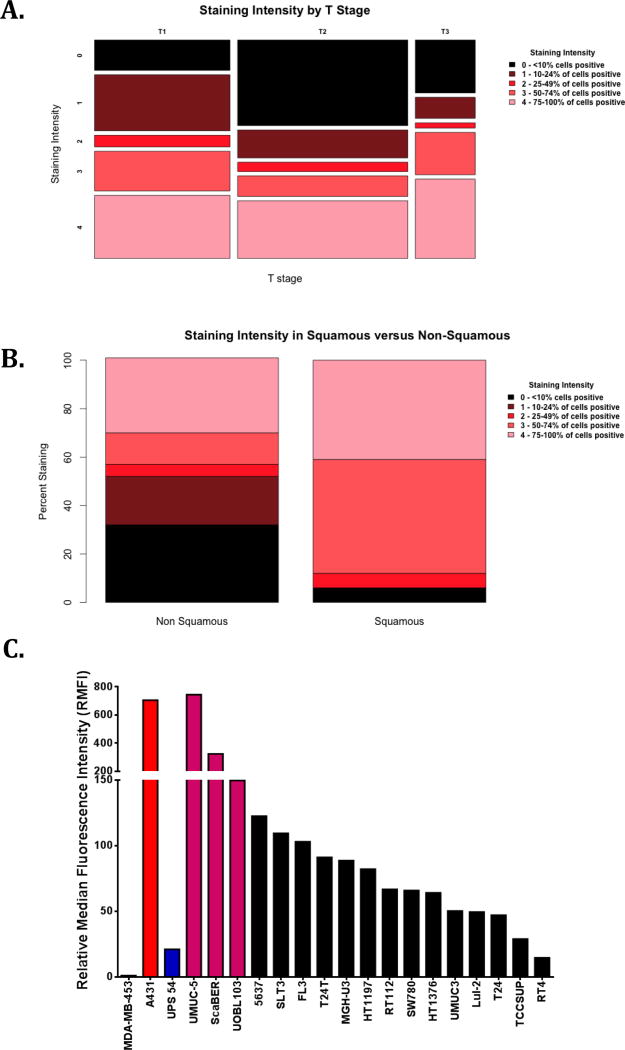
Figure 1. Expression of EGFR in bladder cancer tissues and cell lines.
A. Staining intensity of bladder cancer tissue cores by T stage. Tissue microarrays BL2081 and BL806 (Biomax) were analyzed for presence of EGFR expression using anti-EGFR antibody (CST No. 4267). Each sample was graded for staining as follows: 0=<10% of cells positive (black); 1=10–24% (maroon); 2=25–49 % (red); 3=50–74% (firebrick); 4=75–100% (pink). There is no relationship between EGFR staining and T stage.
B. Staining intensity of non-squamous versus squamous bladder cancers. About 94% of bladder SCC cores in our analysis showed very high expression of EGFR (staining intensities 3 and 4) as compared to non-squamous bladder cancer cores.

