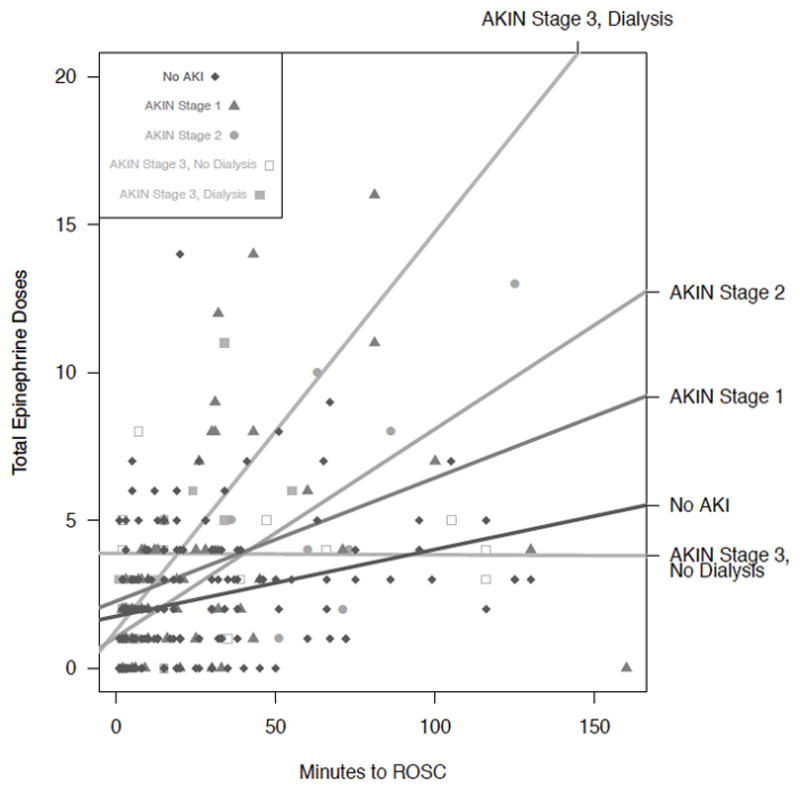
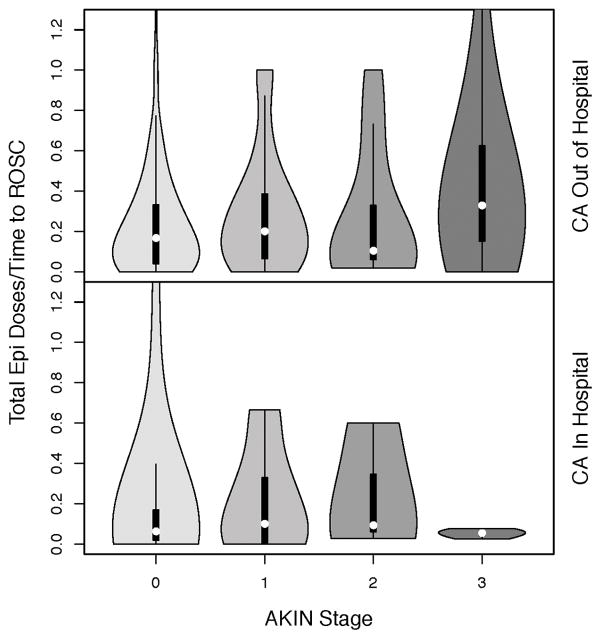
Figure 4.

Figure 4a. The rate at which epinephrine was administered differed by arrest location in the cohort. We observed a higher predicted AKIN Stage for children with IHCA than those with OHCA.
Figure 4b. Violin plot demonstrating the relationships among epinephrine dosing rate, CA location, and AKIN Stage. Violin plots are similar to box plots but, by combining box plots with kernel density plots, are able to demonstrate the full distribution of the data rather than summary statistics alone. In our cohort, subjects experiencing IHCA and receiving a greater total epinephrine dose per time to ROSC reached AKIN Stage 3 AKI at a higher rate. For subjects experiencing OHCA, epinephrine dose per time to ROSC was slightly higher for those subjects who developed AKI of any stage.

