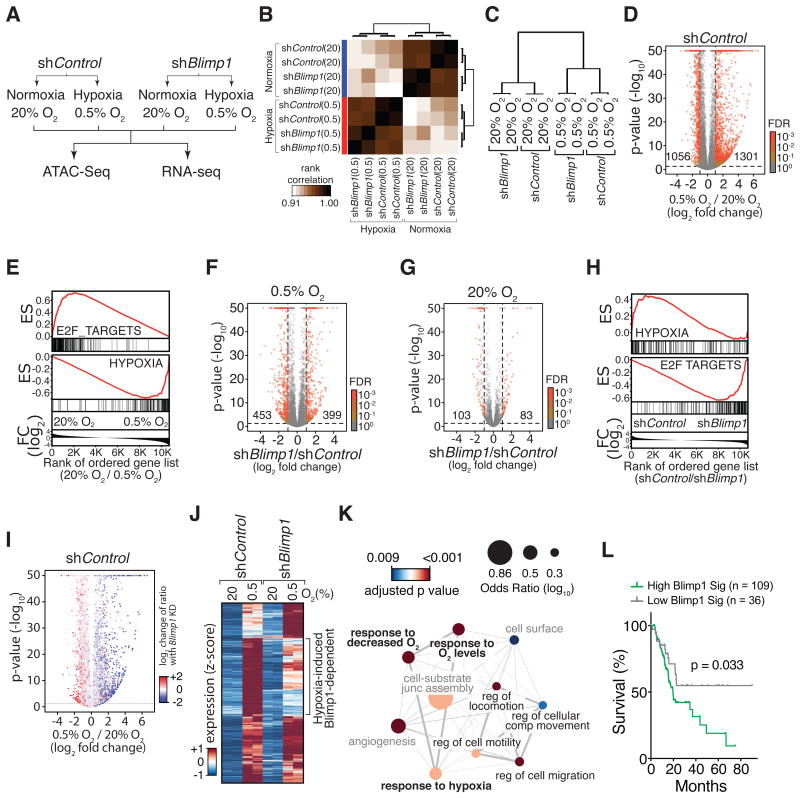
Figure 5. Blimp1 regulates the expression of a subset of hypoxia-induced genes.
(A) The PDAC cell line 688M was cultured for 24 hours under normoxia/hypoxia in vitro for RNA-Seq and ATAC-Seq analyses.
(B) Pearson correlation of all samples based on global chromatin accessibility determined from ATAC-Seq analysis.
(C) Clustering of correlation of samples based on the global gene expression derived from RNA-Seq analysis.
(D) Hypoxia-induced changes in gene expression. Numbers of differentially expressed genes that are significant with FDR < 0.001 are shown.
(E) Genes suppressed by hypoxia are significantly enriched for cell cycle-related programs (E2F_TARGETS). Genes induced by hypoxia are significantly enriched for a hypoxia signature. ES, enrichment score; FC, fold change.
(F,G) Gene expression differences between shBlimp1 and shControl cells cultured under hypoxia (F) and normoxia (G). Numbers of differentially expressed genes that are significant with FDR < 0.001 are shown.
(H) Blimp1-repressed genes under hypoxia are significantly enriched for cell cycle-related programs (bottom panel). GSEA was conducted by comparing the transcriptomes of shControl and shBlimp1 cells cultured under hypoxia. ES, enrichment score; FC, fold change.
(I) Blimp1 knockdown reduces the induction of hypoxia-induced genes (blue) while de-represses hypoxia-suppressed genes (red). Change of ratio under Blimp1 knockdown is defined as the ratio of a, “fold change of gene expression induced by hypoxia in shBlimp1 cells” over b, “fold change of gene expression induced by hypoxia in shControl cells”. p-values are adjusted with a FDR = 0.1.
(J) About 35% of hypoxia-induced genes required Blimp1 for their full induction and were less induced by hypoxia in shBlimp1 cells (log2 fold change < -0.5).
(K) GO term analysis of hypoxia-induced, Blimp1-dependent genes defined in (J). Significantly enriched biological processes are shown. Node size represents odds ratio (log10) and color shows adjusted p-values. Thickness of lines connecting nodes represents percent of shared genes between connected processes. Hypoxia (bold) and cell mobility (black font) related processes are highlighted.
(L) Hypoxia-induced, Blimp1-dependent genes (BLIMP1 Sig.) predict PDAC patient outcome. Single sample GSEA (ssGSEA) scores for the BLIMP1 Sig. were used to separate the top three from the bottom quartile of TCGA patients.

