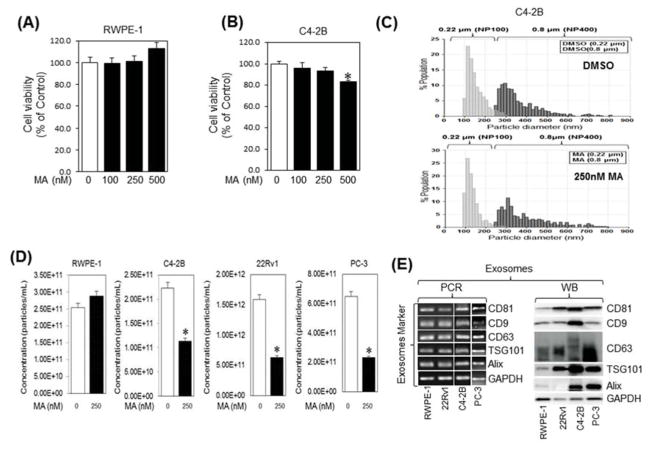
Fig. 2.
Manumycin A (MA) inhibits the exosome release by C4-2B cells. RWPE-1 (A) and C4-2B (B) cells were incubated overnight in 96-well cell culture plates with the indicated concentrations of Manumycin A or vehicle (DMSO) and analyzed for cell viability for 48 h, respectively. The IC50 concentration values for C4-2B cells were extrapolated from the sigmoid dose response curve fitting (GraphPad Prism software). The error bars represent the 95% confidence intervals of three independent experiments. (C) Following differential ultracentrifugation, extracellular vesicles and exosomes populations in the conditioned medium (CM) of DMSO (upper panel) or MA (250 nM; lower panel) were prepared by filtration through 0.8 μM and 0.22 μM filters, respectively, and their size distribution was analyzed by qNano-IZON system using NP400 and NP-100 nanopores, respectively. (D) qNano-IZON particle quantitative analysis (NP-100 nanopore) depicting a significant decrease in exosome concentrations (50–200 nm size) in the CM of RWPE-1, C4-2B, 22Rv1 and PC-3 cells treated with MA compared to vehicle treated controls. (E) Expression of exosome markers tetraspanins (CD9, CD63, and CD81) and exosome biogenesis markers Alix and TSG101 in the exosomes of RWPE-1, C4-2B, 22Rv1, and PC-3 cells harvested by UC and filtration (0.22 μm). GAPDH was used a control. *denotes significance at p<0.05 compared to control.

