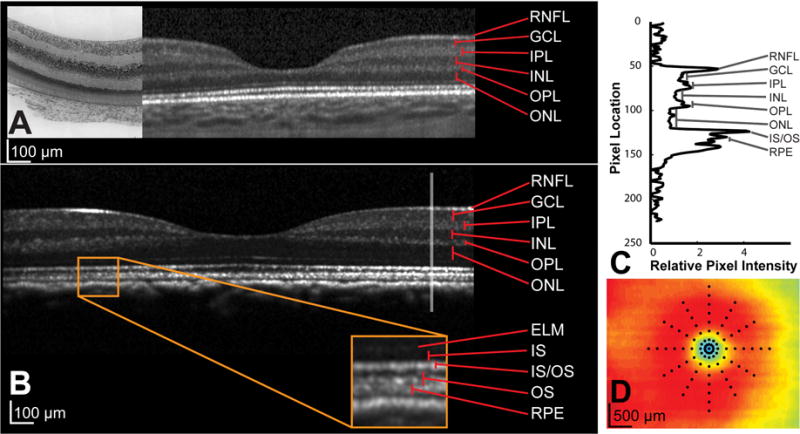
Figure 4.

A. OCT section through fovea of a 10 day old infant with corresponding histology stained with Cresyl violet from the same animal. B. OCT section through the foveal region, of a 1.5 year old animal. C. Each layer was manually identified on the OCT B-scan with the assistance of reflectivity profiles, through the region of interest. The reflectivity profile illustrated is generated from the gray vertical line shown in B. D. For each eye, layer thicknesses at 89 points illustrated on the thickness plot were measured and monitored over time.
