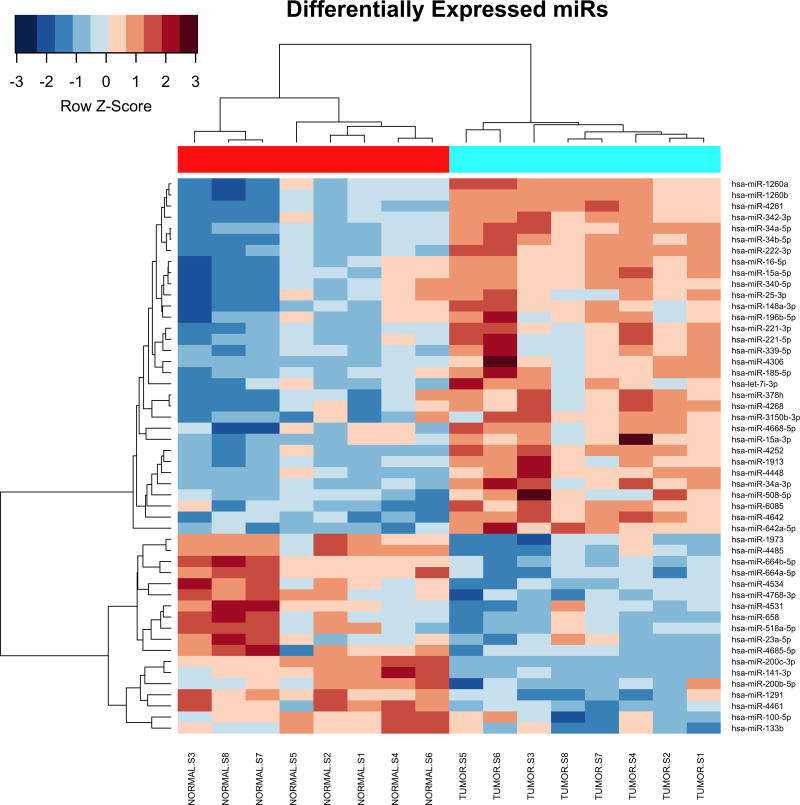
Figure 2.
MicroRNA expression profile Xp11 RCC. Heat-map showing the top 50 mature miRNAs most significantly differentially expressed between matched Xp11 RCC tumors and normal samples (highlighted in cyan and red respectively in the figure). Hierarchical clustering was obtained using the Pearson’s distance and the average clustering method.

