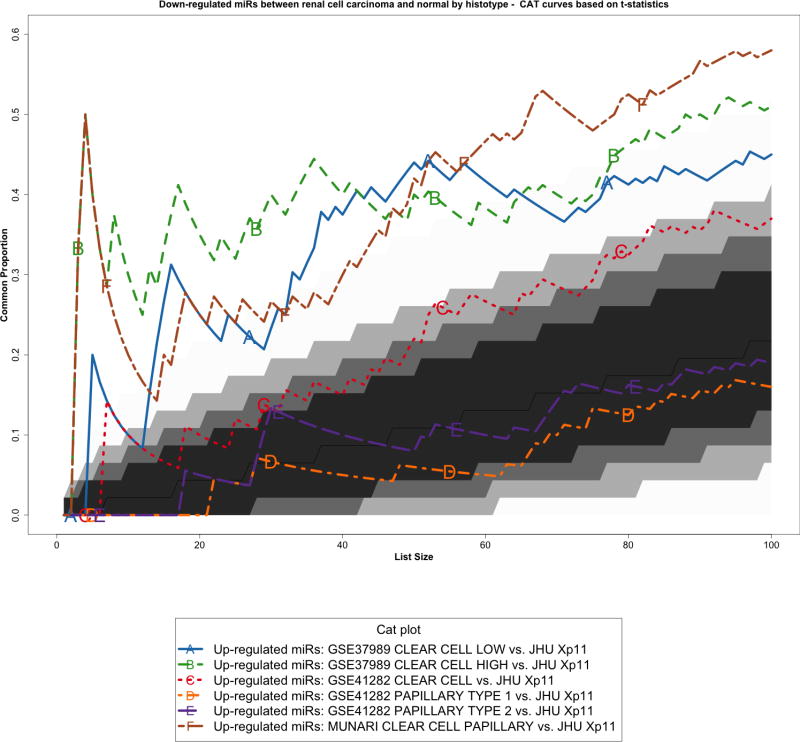
Figure 3.
Correspondence at the top (CAT) curves for all up-regulated microRNAs in common between our Xp11 dataset and three previously published datasets encompassing distinct RCC subtypes (Munari et al, GSE37989, and GSE41282). Genes were ranked based on the moderated t-statistics obtained from our linear model analysis. Each CAT curve represents the proportion of differentially expressed microRNA in common between two expression profiles comparing tumor and normal samples. All microRNA expression profiles obtained from the different RCC groups analyzed using public domain data were compared to the one obtained using Xp11 RCC samples (reference profile). CAT curves in the white area above the gray shading indicate significant agreement, while the curves below indicate significant disagreement between expression profiles. The grey shading represents the 99.9% probability intervals of agreement by chance, therefore CAT curves in the white represent agreement beyond what it would be expected by chance alone. Overall we observed good agreement between Xp11 and clear cell papillary RCC, and between Xp11 and clear cell RCC.

