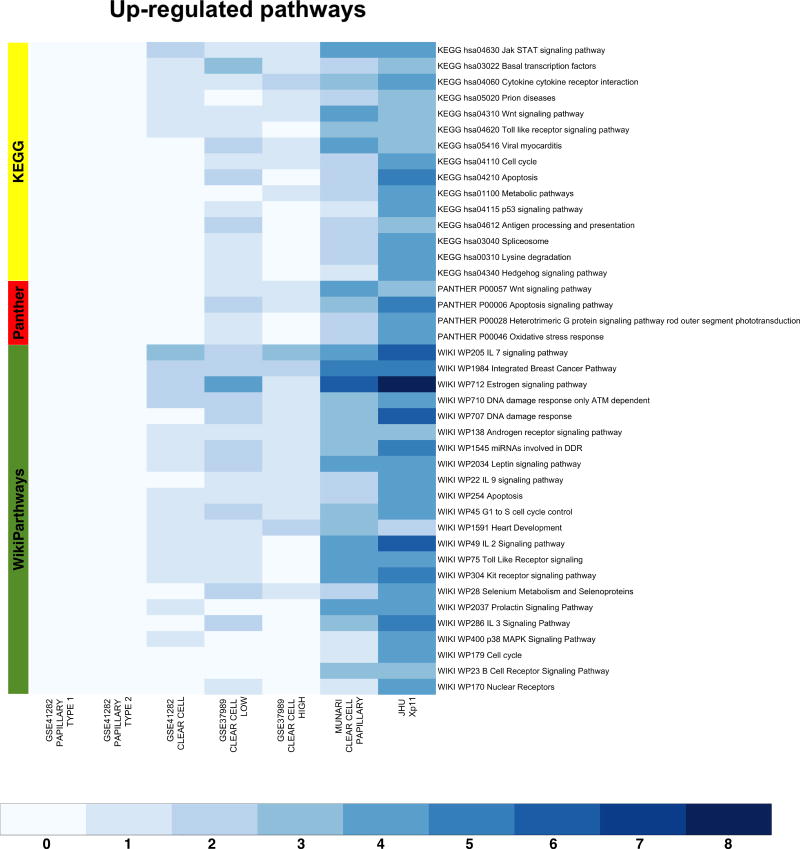
Figure 4.
Heat-maps visualizing up-regulated functional gene sets (FGS) as determined by Analysis of Functional Annotation (AFA) performed on microRNAs expression profiles associated with Xp11 and other types of RCC. Each row represents a distinct FGS, while each column represents a distinct coefficient from our linear model analysis. The FGS that were most significantly up-regulated across any comparison performed are shown in the figure (FDR ≤ 0.00025%, or less). Color scales correspond to the absolute adjusted p-values obtained from our analysis after base 10 logarithmic transformations (i.e., the number on the color scale increases with decreasing FDR). Up-regulated FGS were selected from different collections to capture signaling pathways and biological themes modulated by microRNA expression in RCC. The databases used are highlighted on the left: PantherPath in red, KEGG in green, and WikiPathways in yellow. Complete tables with results from enrichment test are reported in Table 2 and Supplementary Table S2 (also available at http://luigimarchionni.org/Xp11RCC.html).

