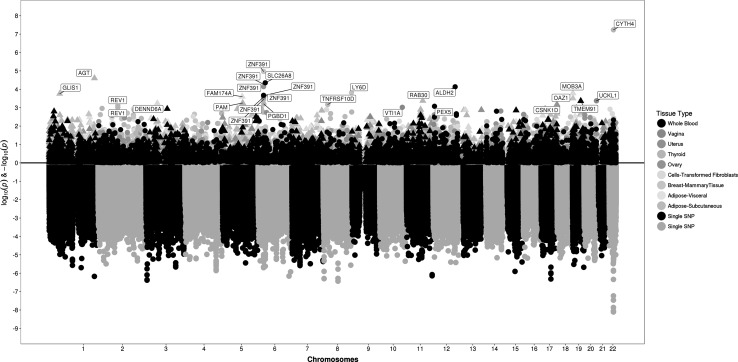
Fig. 2.
Top panel presents (as a mirror of the association results) the association with predicted gene expression levels from relevant tissues from GTEx, also arranged by chromosome and position; bottom panel presents SNP association results from meta-analysis across both stages in an inverted Manhattan plot format, arranged by chromosome and position

