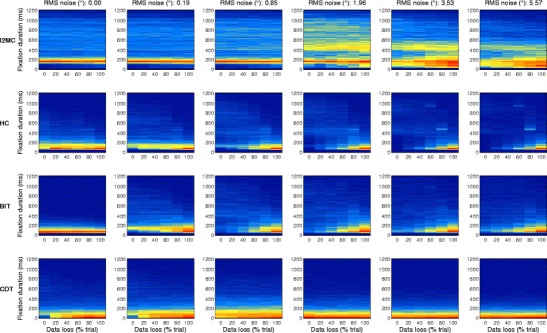
Fig. 7.

2-D histograms of fixation durations for fixations detected by the I2MC, HC, BIT, and CDT algorithms. The columns depict different noise levels, from low (left) to high (right). Within each histogram, five levels of data loss are depicted, from 0 % (left) to 100 % (right) of the trial. Redder colors indicate more detected fixations, and bluer colors fewer detected fixations
